Client
Bikevo Srl
Year
2019
Role
- UX/UI Designer freelance
What we did
- UX Strategy
- User flows
- User test
- Wireframing
- Final UI
Link
Re-invent a virtual trainer for cyclists.
Bikevo is an app for cyclists that create a personalized training plan based on the level, availability (time), and the goals of the user.
An algorithm, based on models used to train the best cyclist in the world, create the best plan that suits user need and goals.
Bikevo needed a mobile app to create a “portable” and “easy” coach for cyclists of all levels and ages.
Limitations
The first MVP was developed in a very short time, and some backend logics have been already created so we cannot review them during the first period.
How we approached
the project
The aim of the project was to rebuild the old Bikevo app implementing some new functionalities, refreshing the experience, and the interface.
I started mapping the whole experience on the old application, trying to find the main pain points, and having a big picture of the flows and functions.
Then we moved to define the flows and the architecture related to the five main areas of the app: Hub, Training Plan, Profile, Insurance & settings. (MVP 1).
Before releasing the MVP1 we did 5 user tests (Why you only need to test with just 5 users ) of different ages and with different cycling expertise, to validate our designs.
Once done, we moved to the secondary group of functionalities to add (MVP 2).
The project is still ongoing.
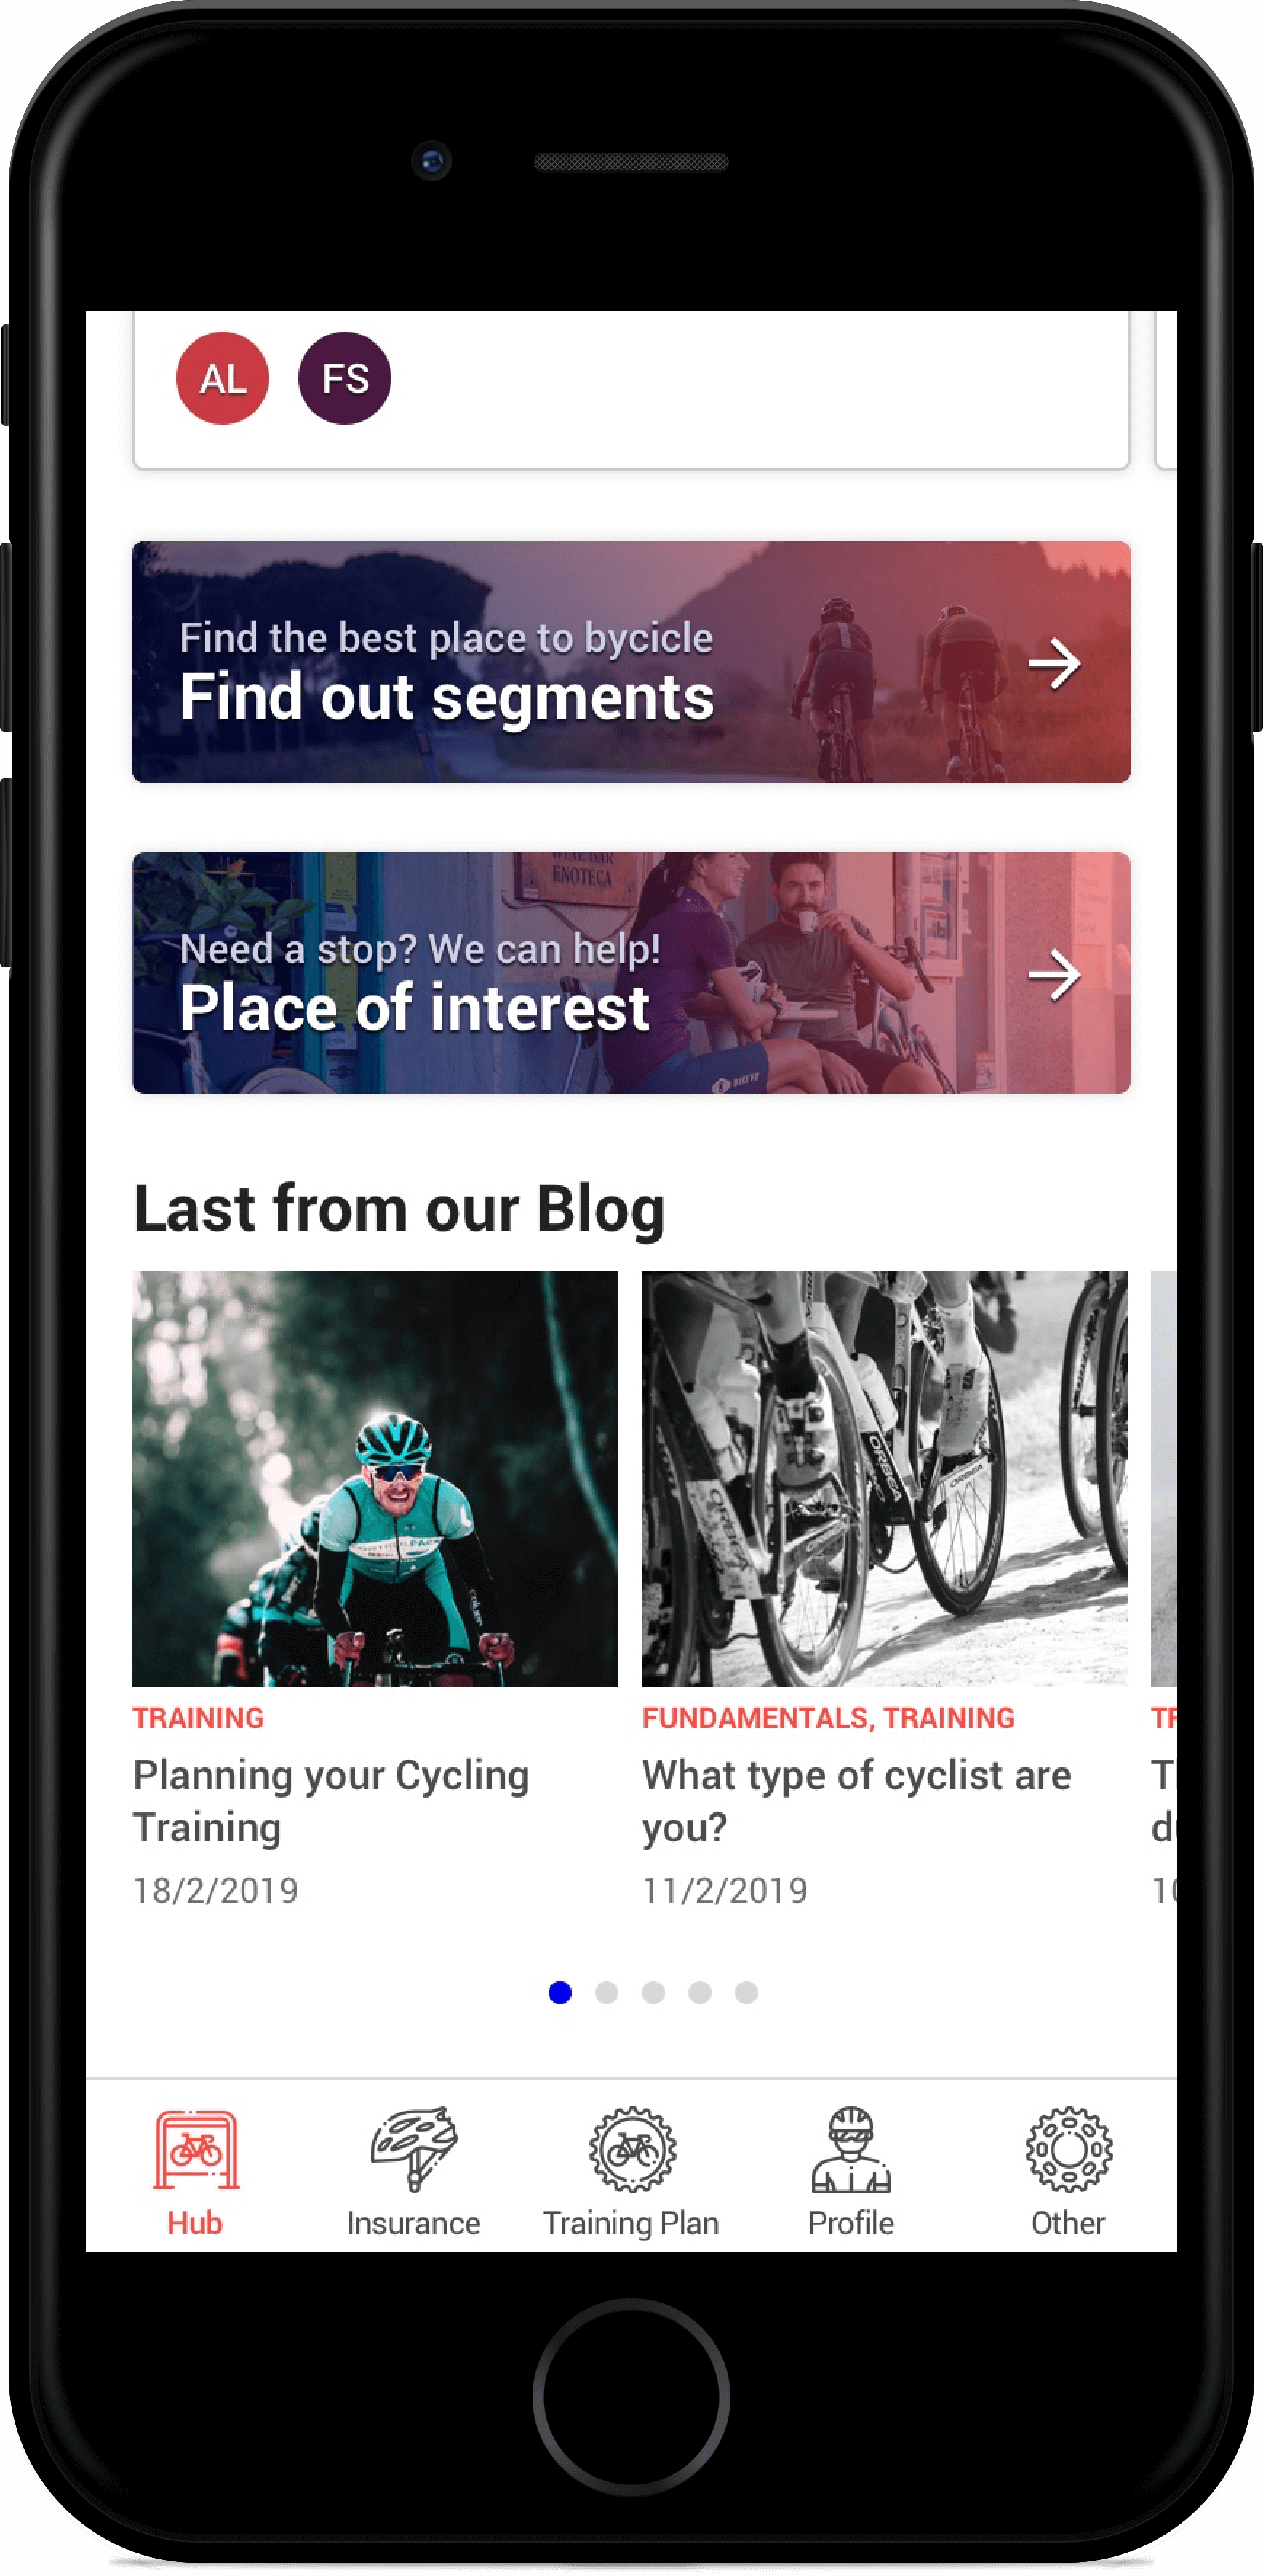
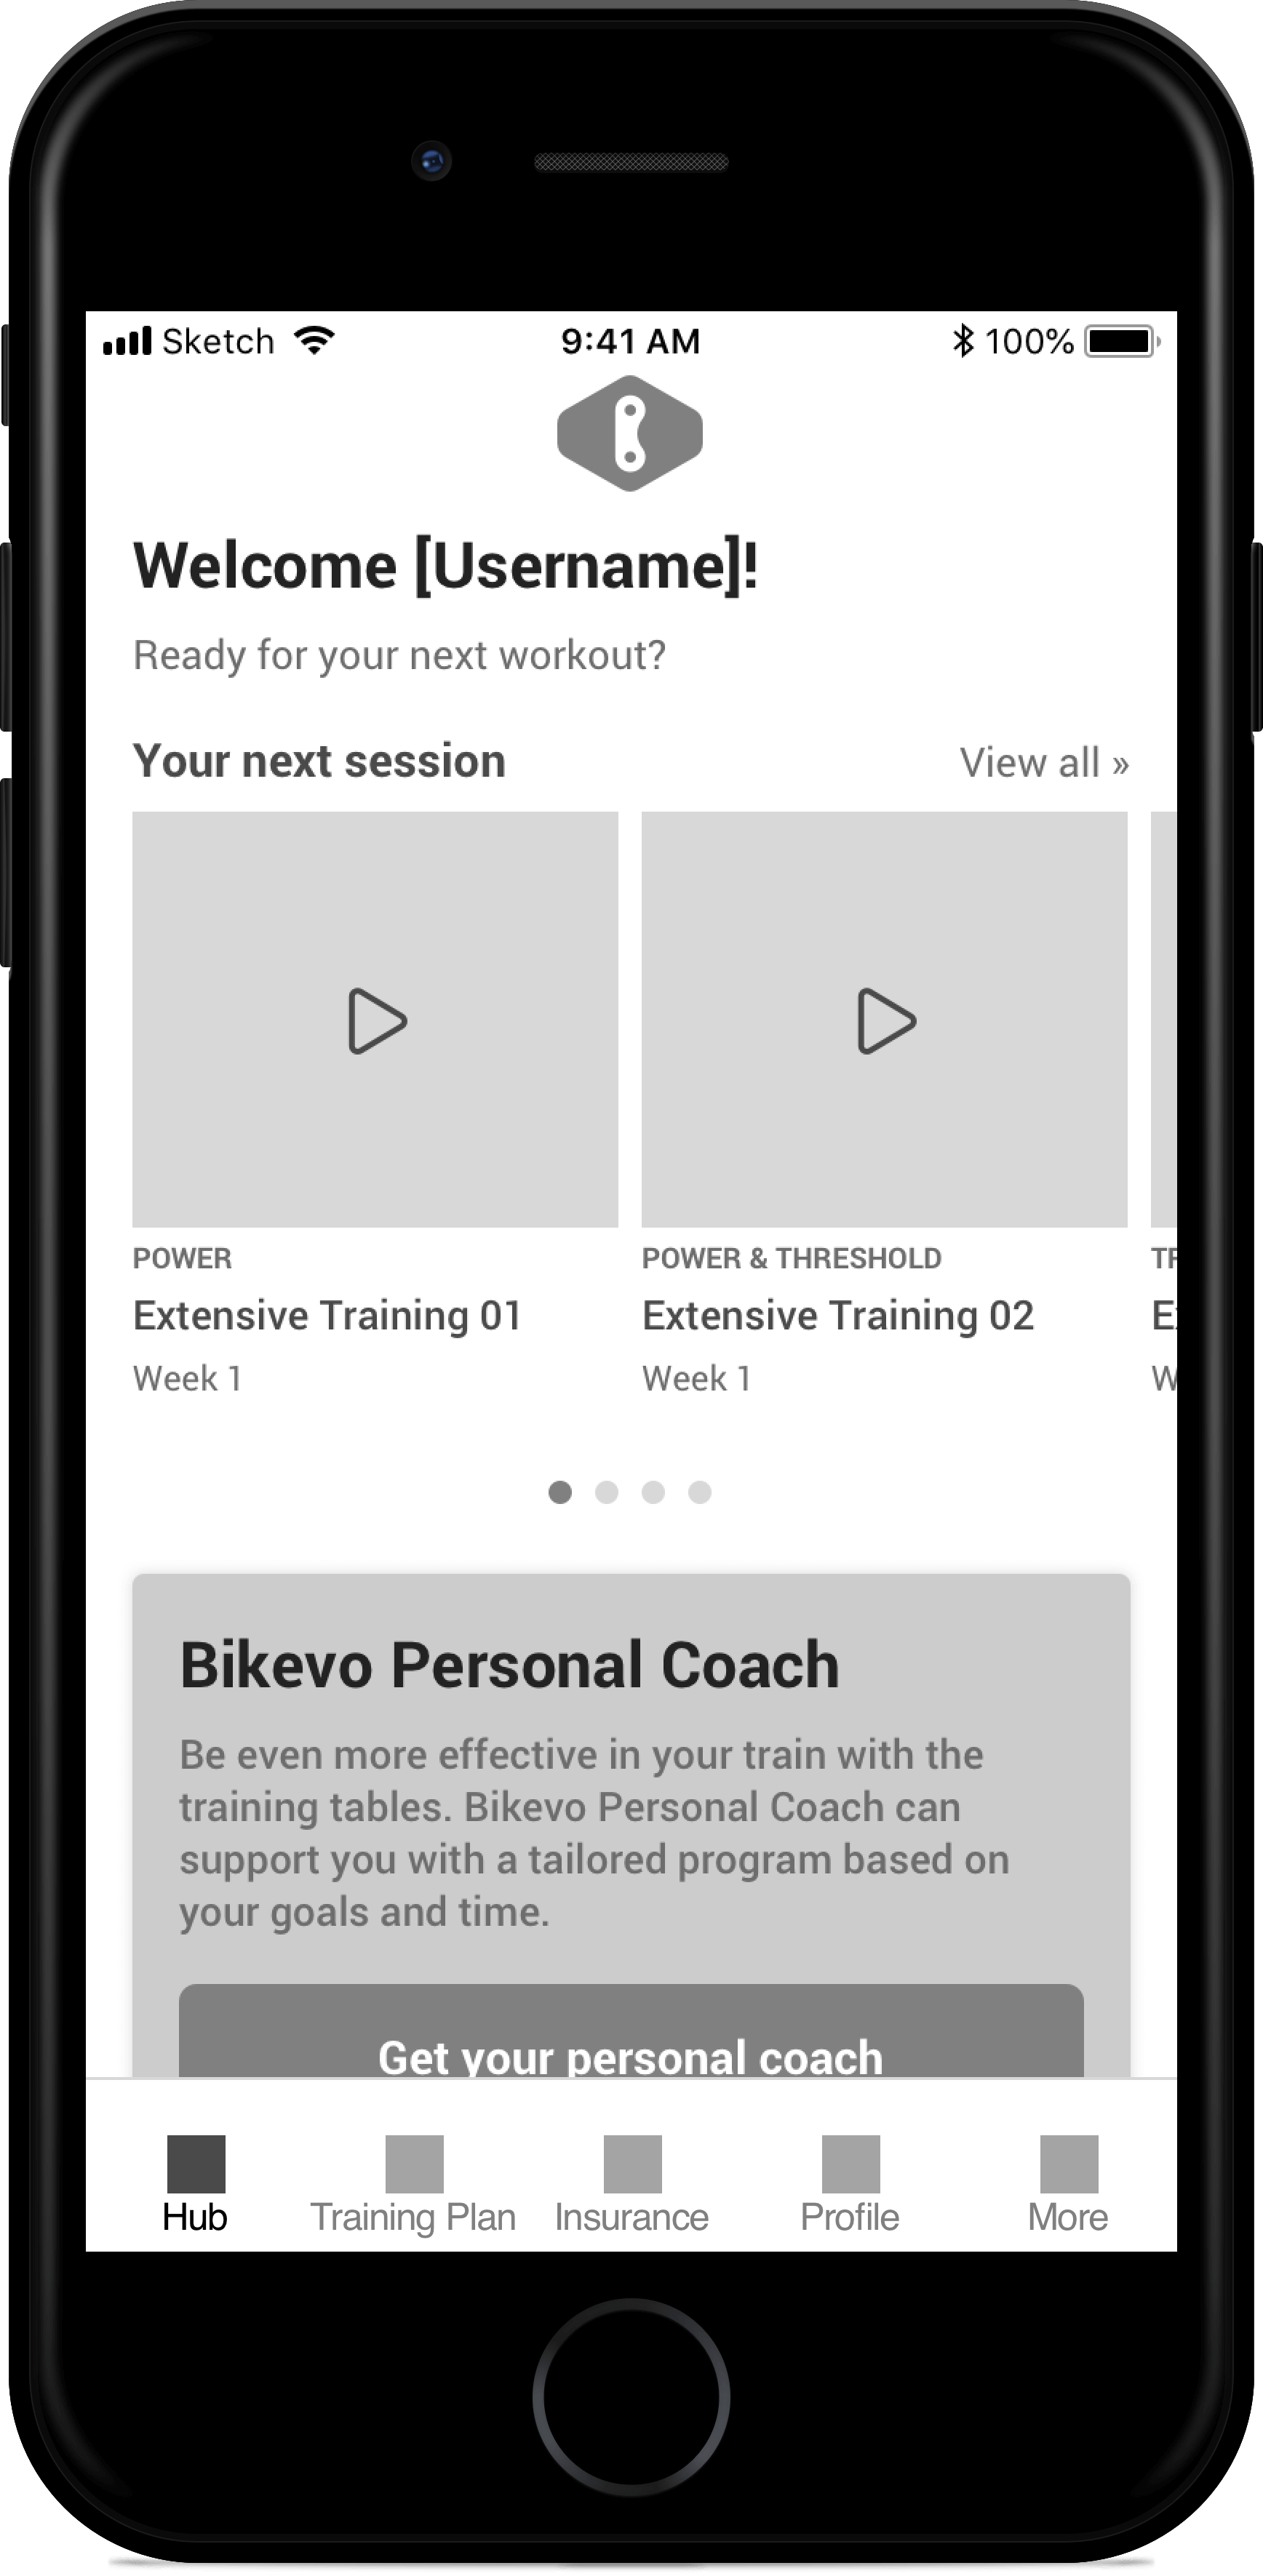
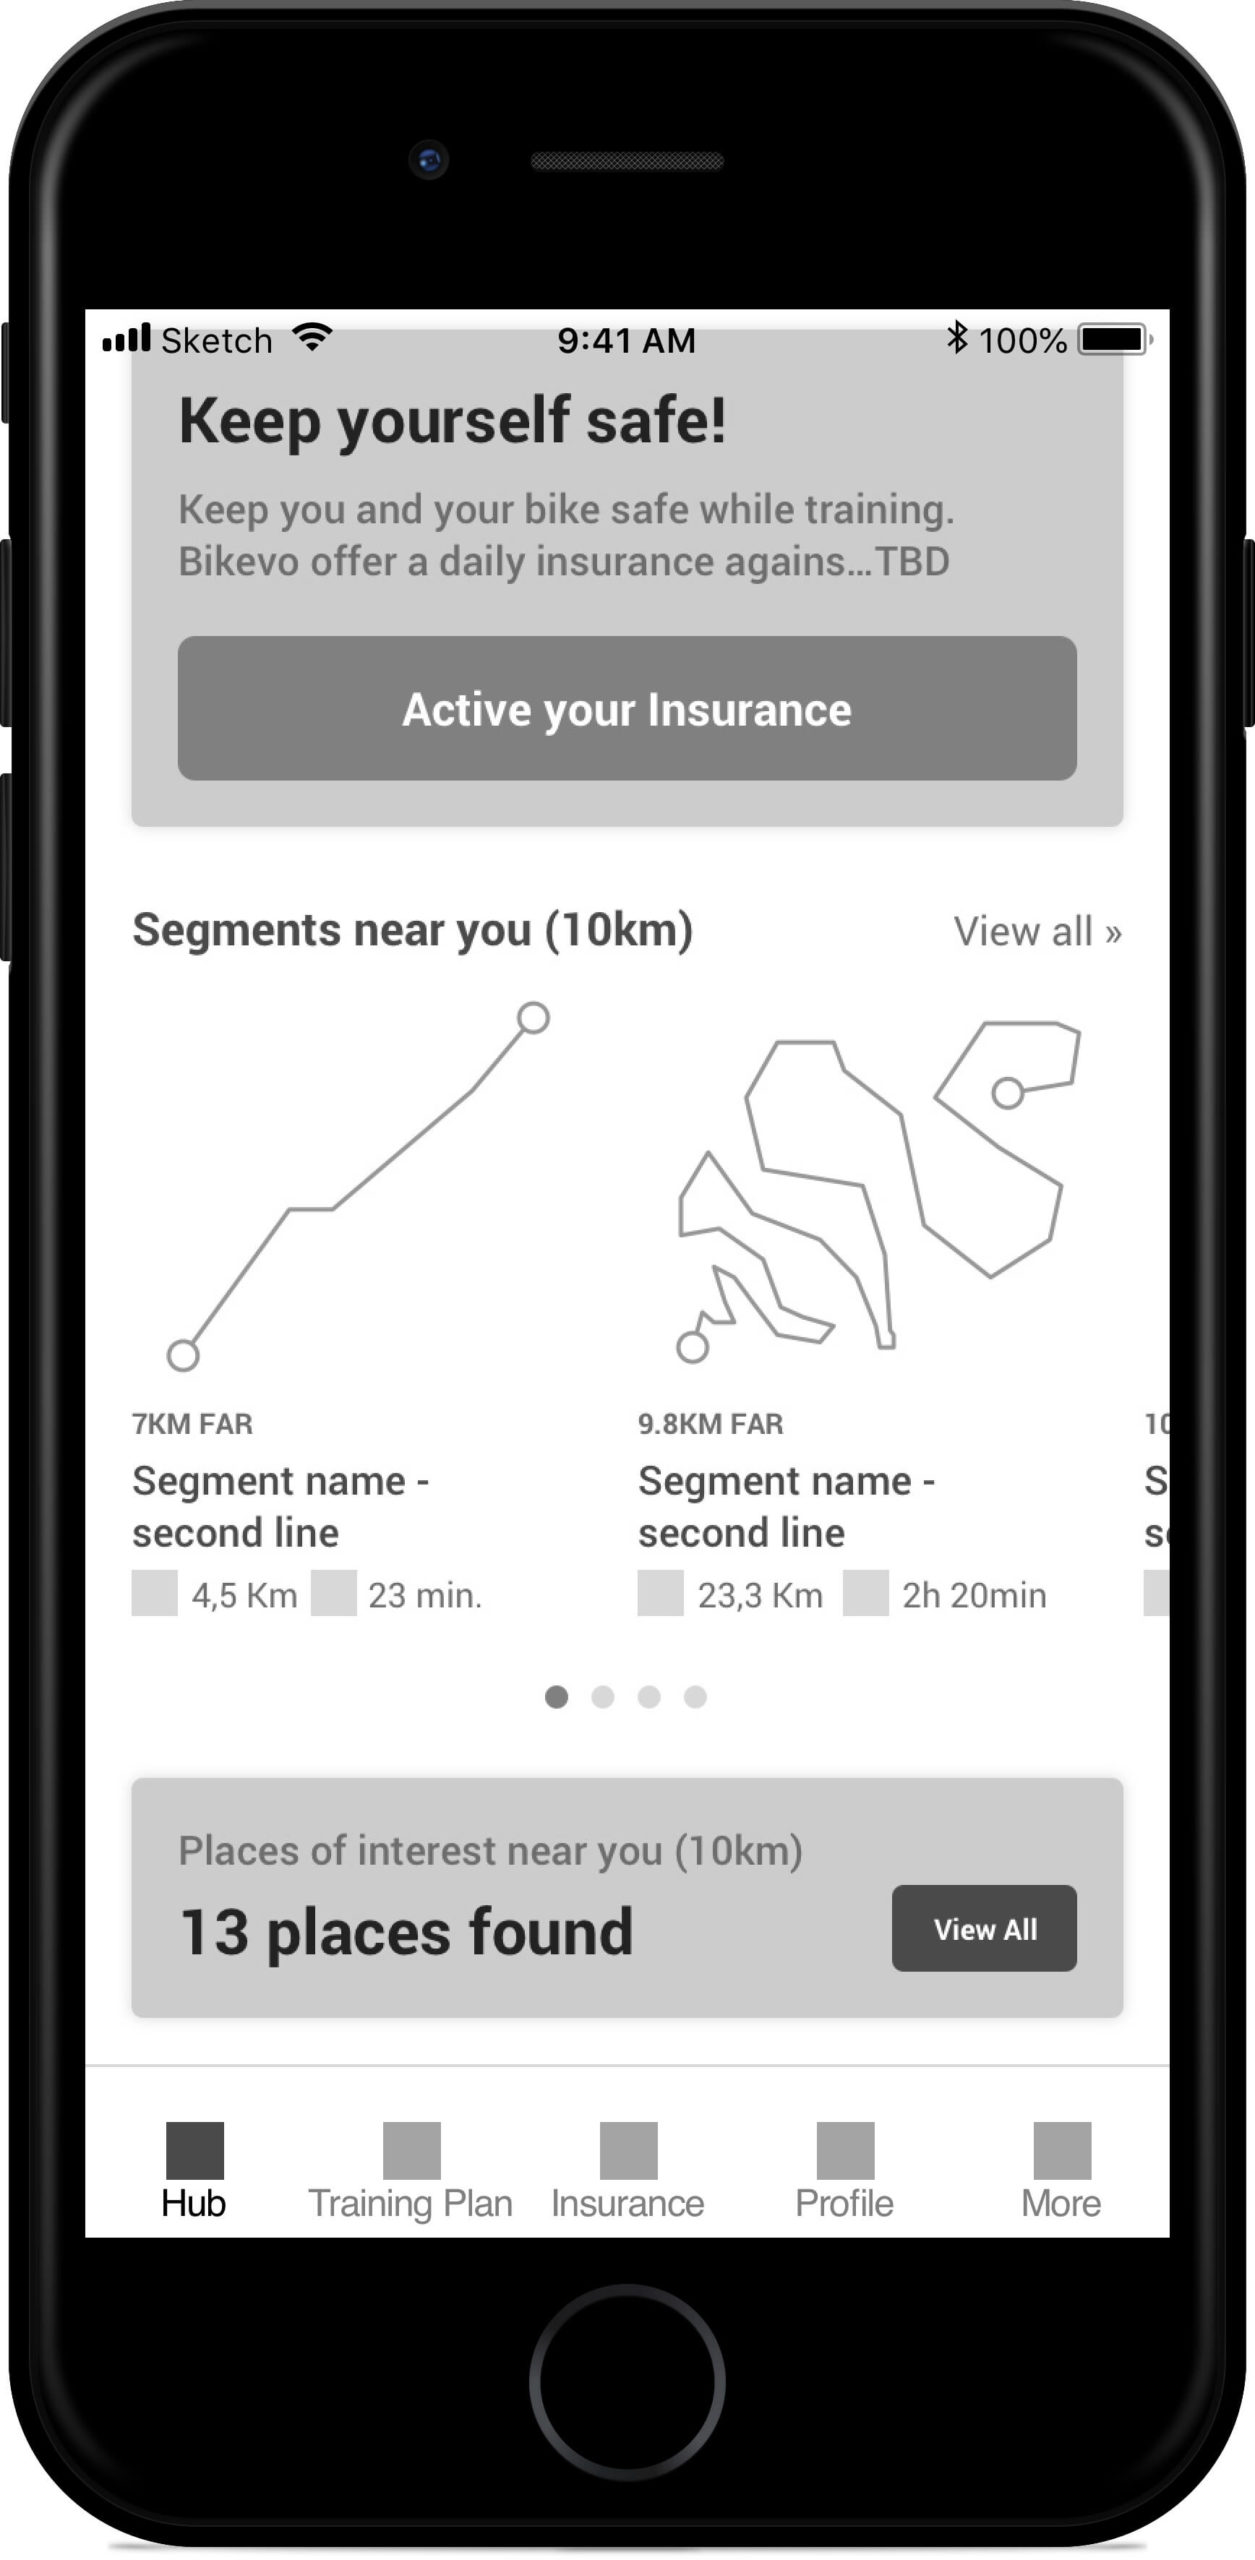
Hub page
Hub page is the main page of the app when the user lands after the onboarding process or every time he open Bikevo.
The goal of the page is to give an overview of the current status of the user: progress, training sessions to attend, important action to do, tips from the blog, and some useful information for cyclists based on location.
The page is modular and card-based.
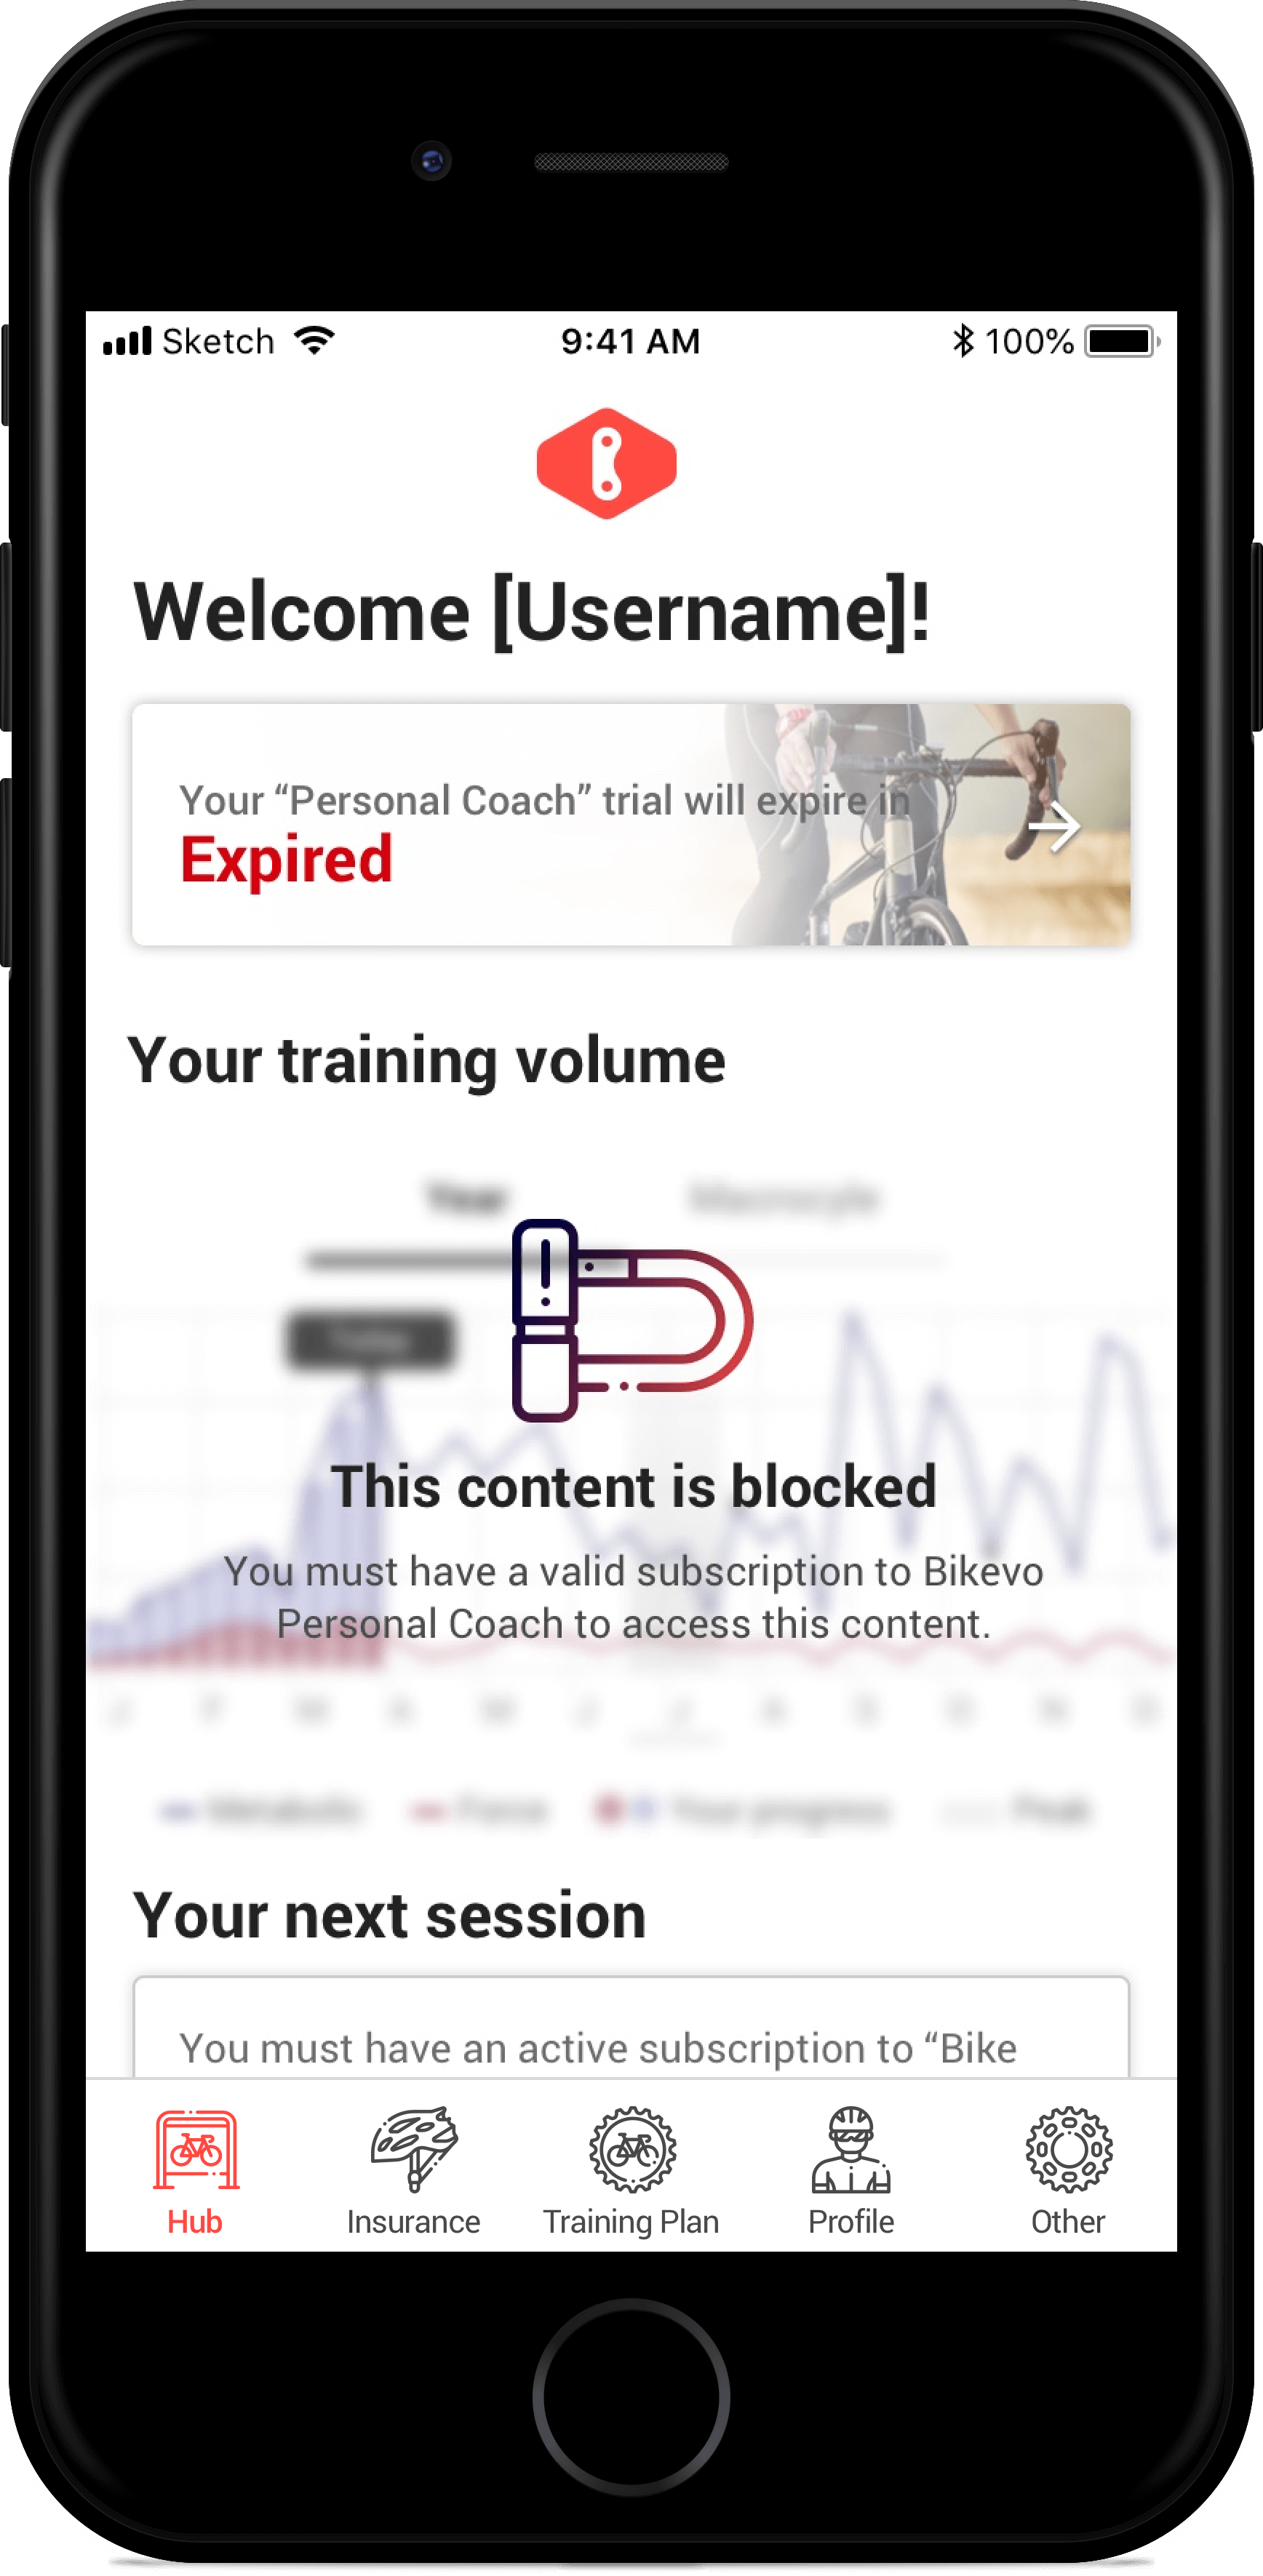
Depending on the type of the account, actions done and progress achieved, this page could have more than 9 different versions.
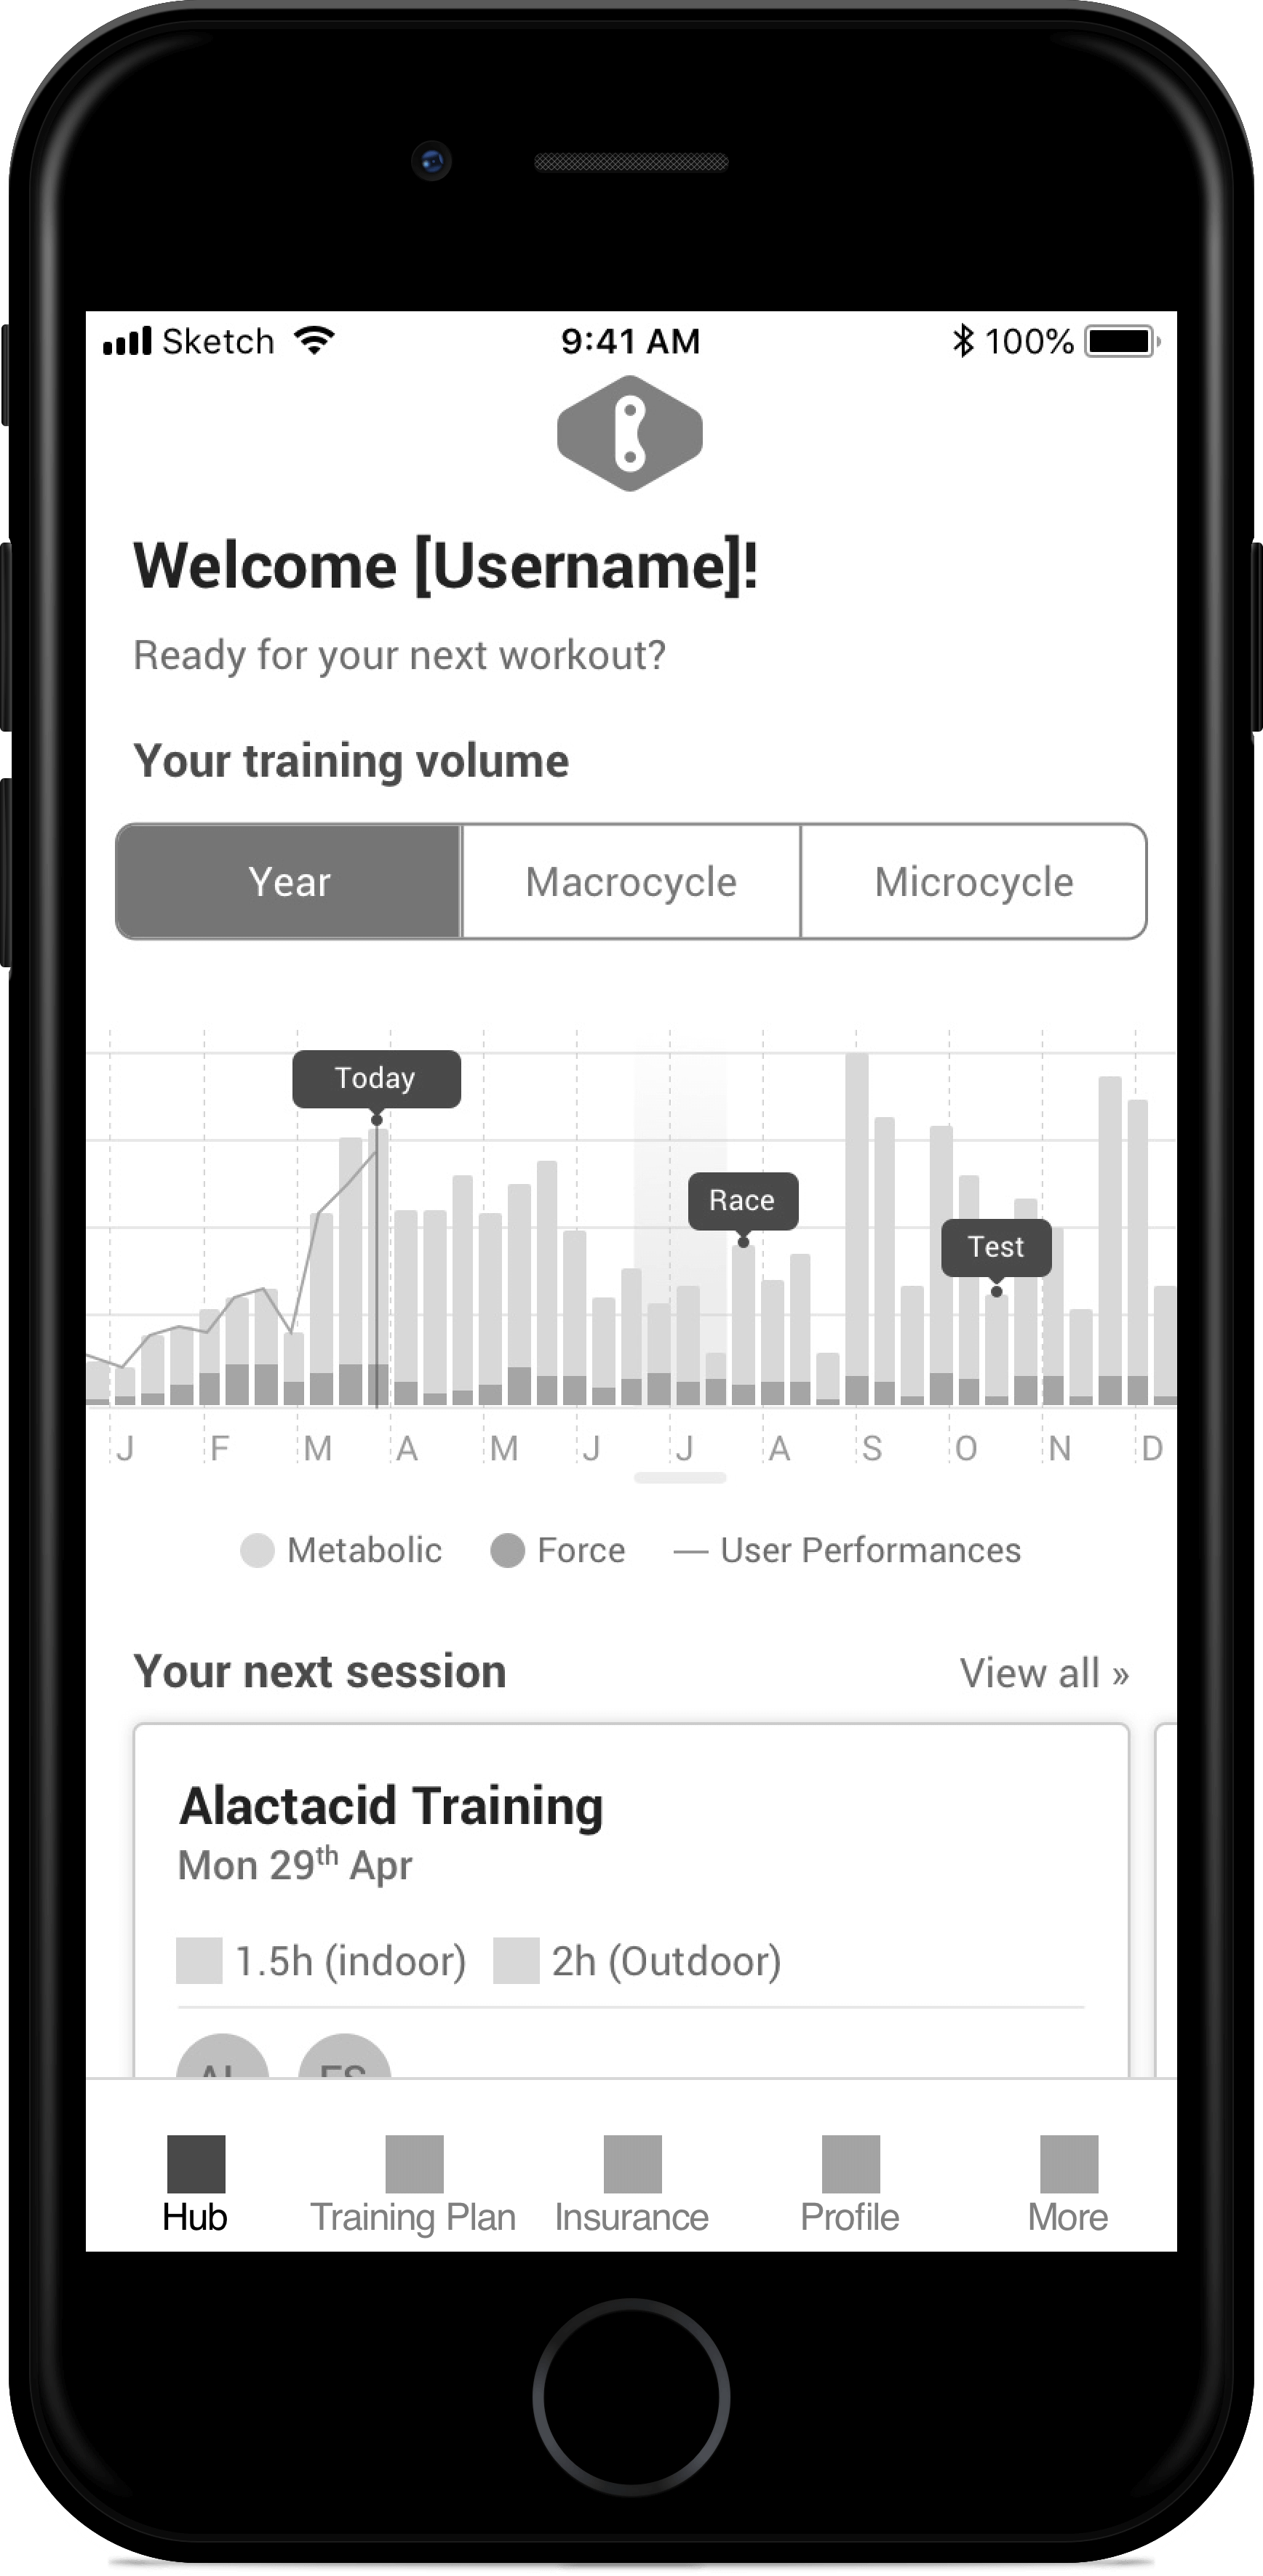
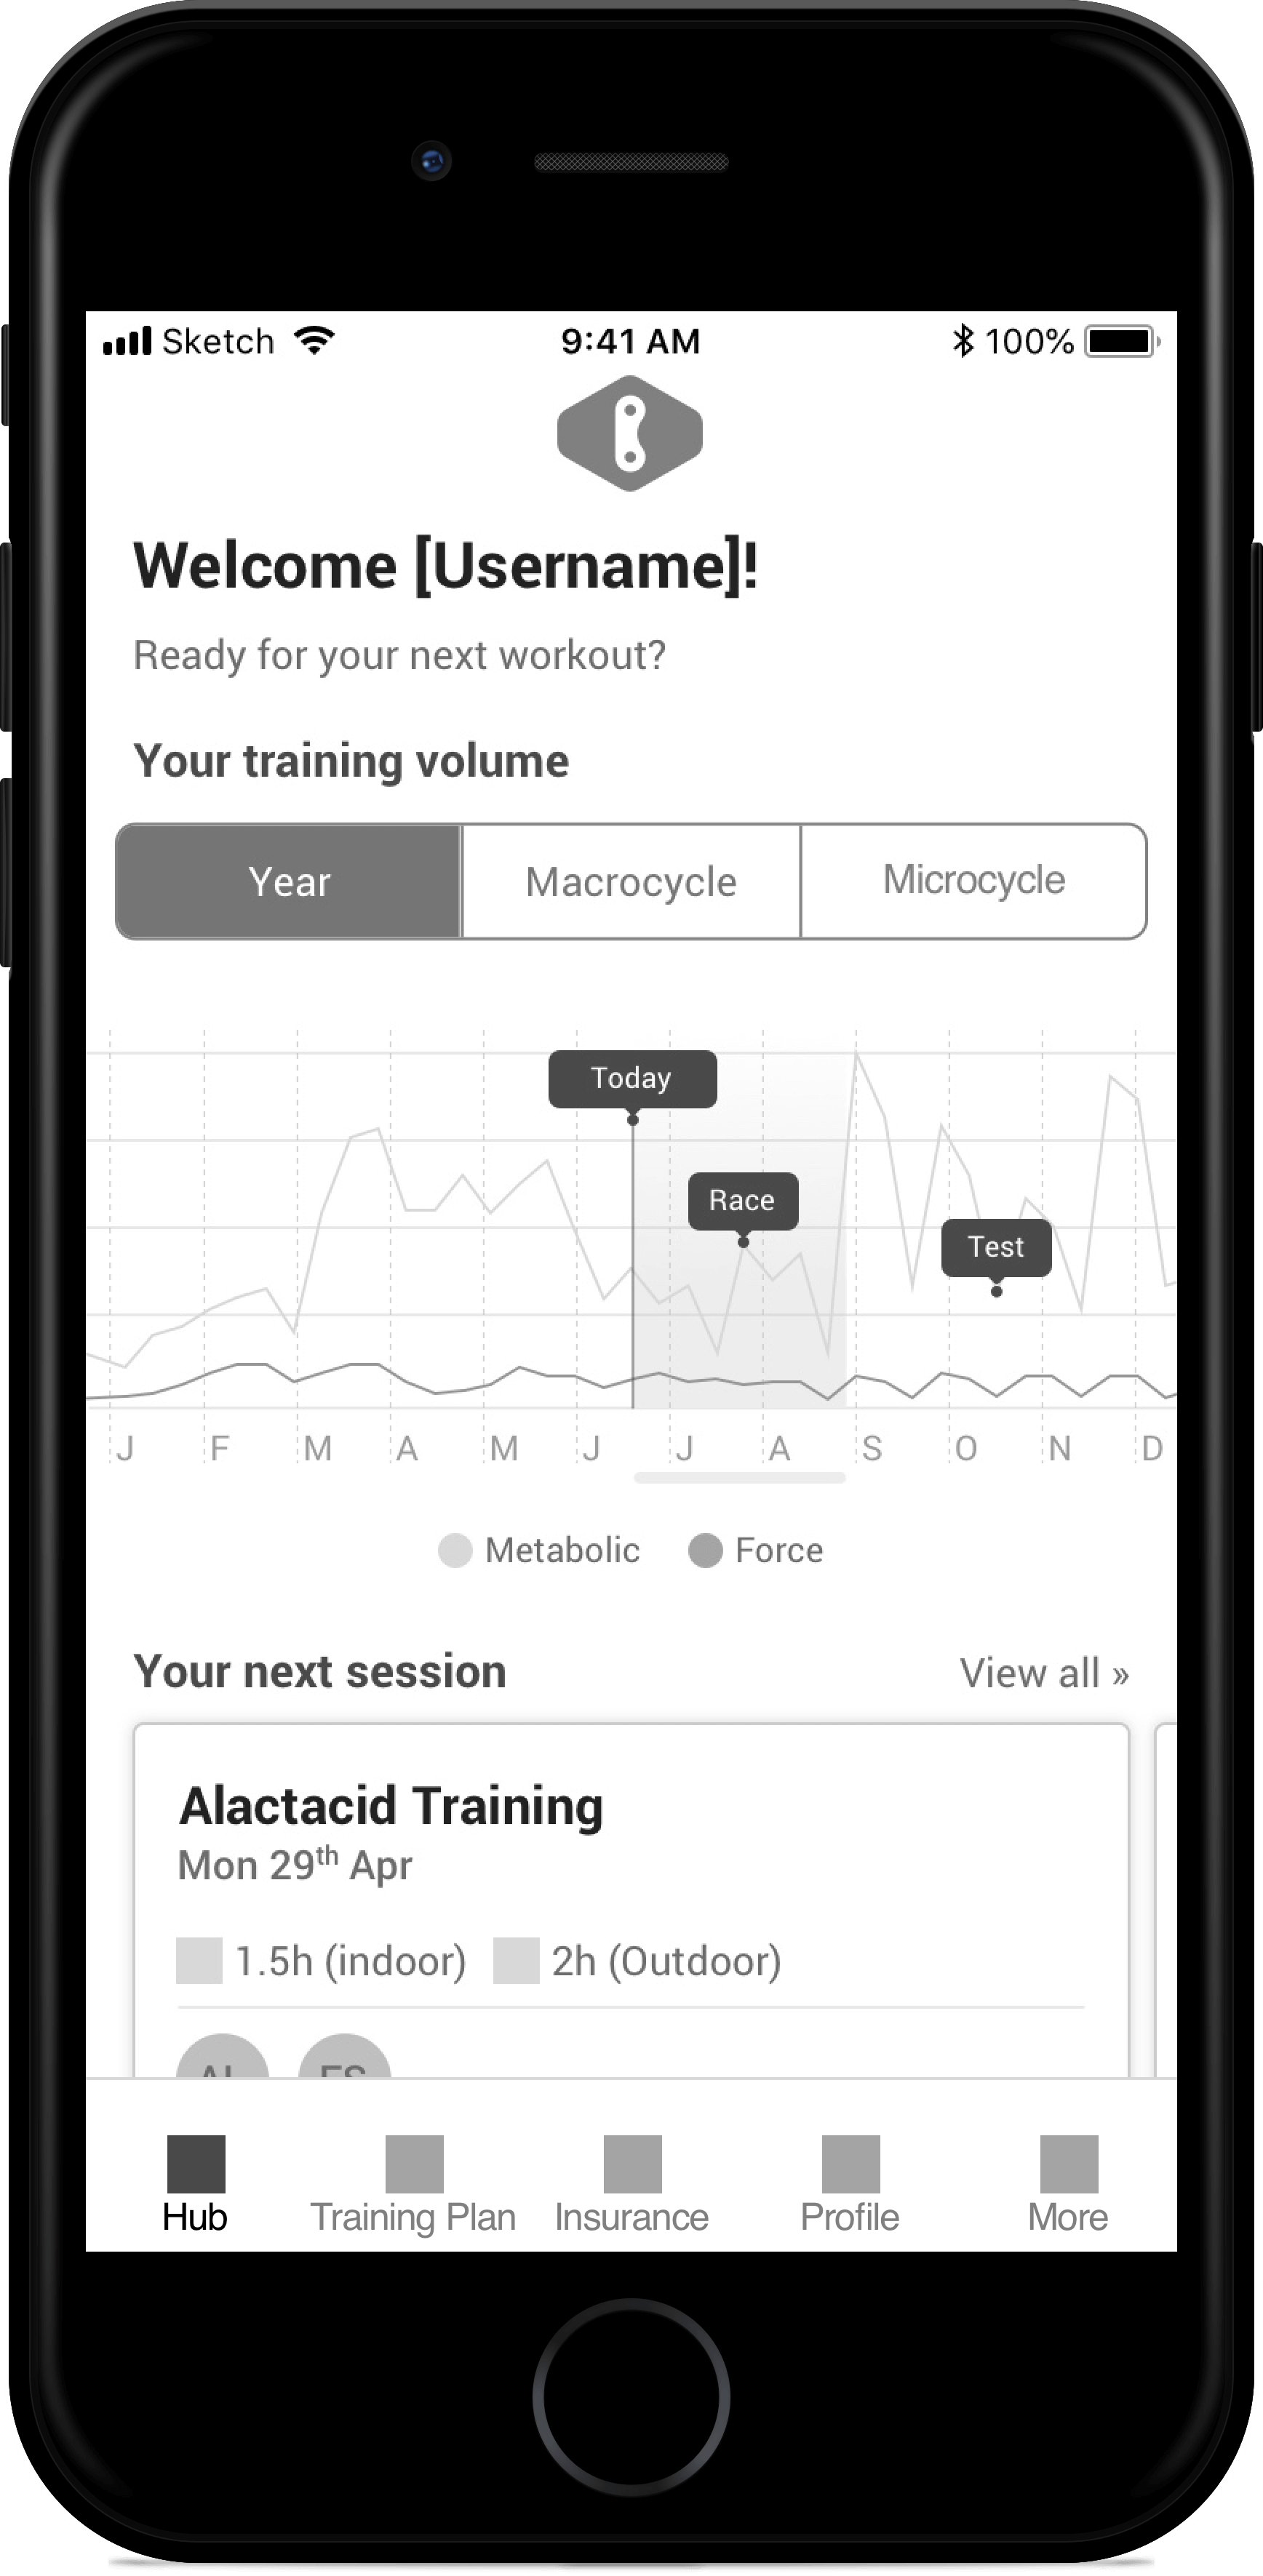
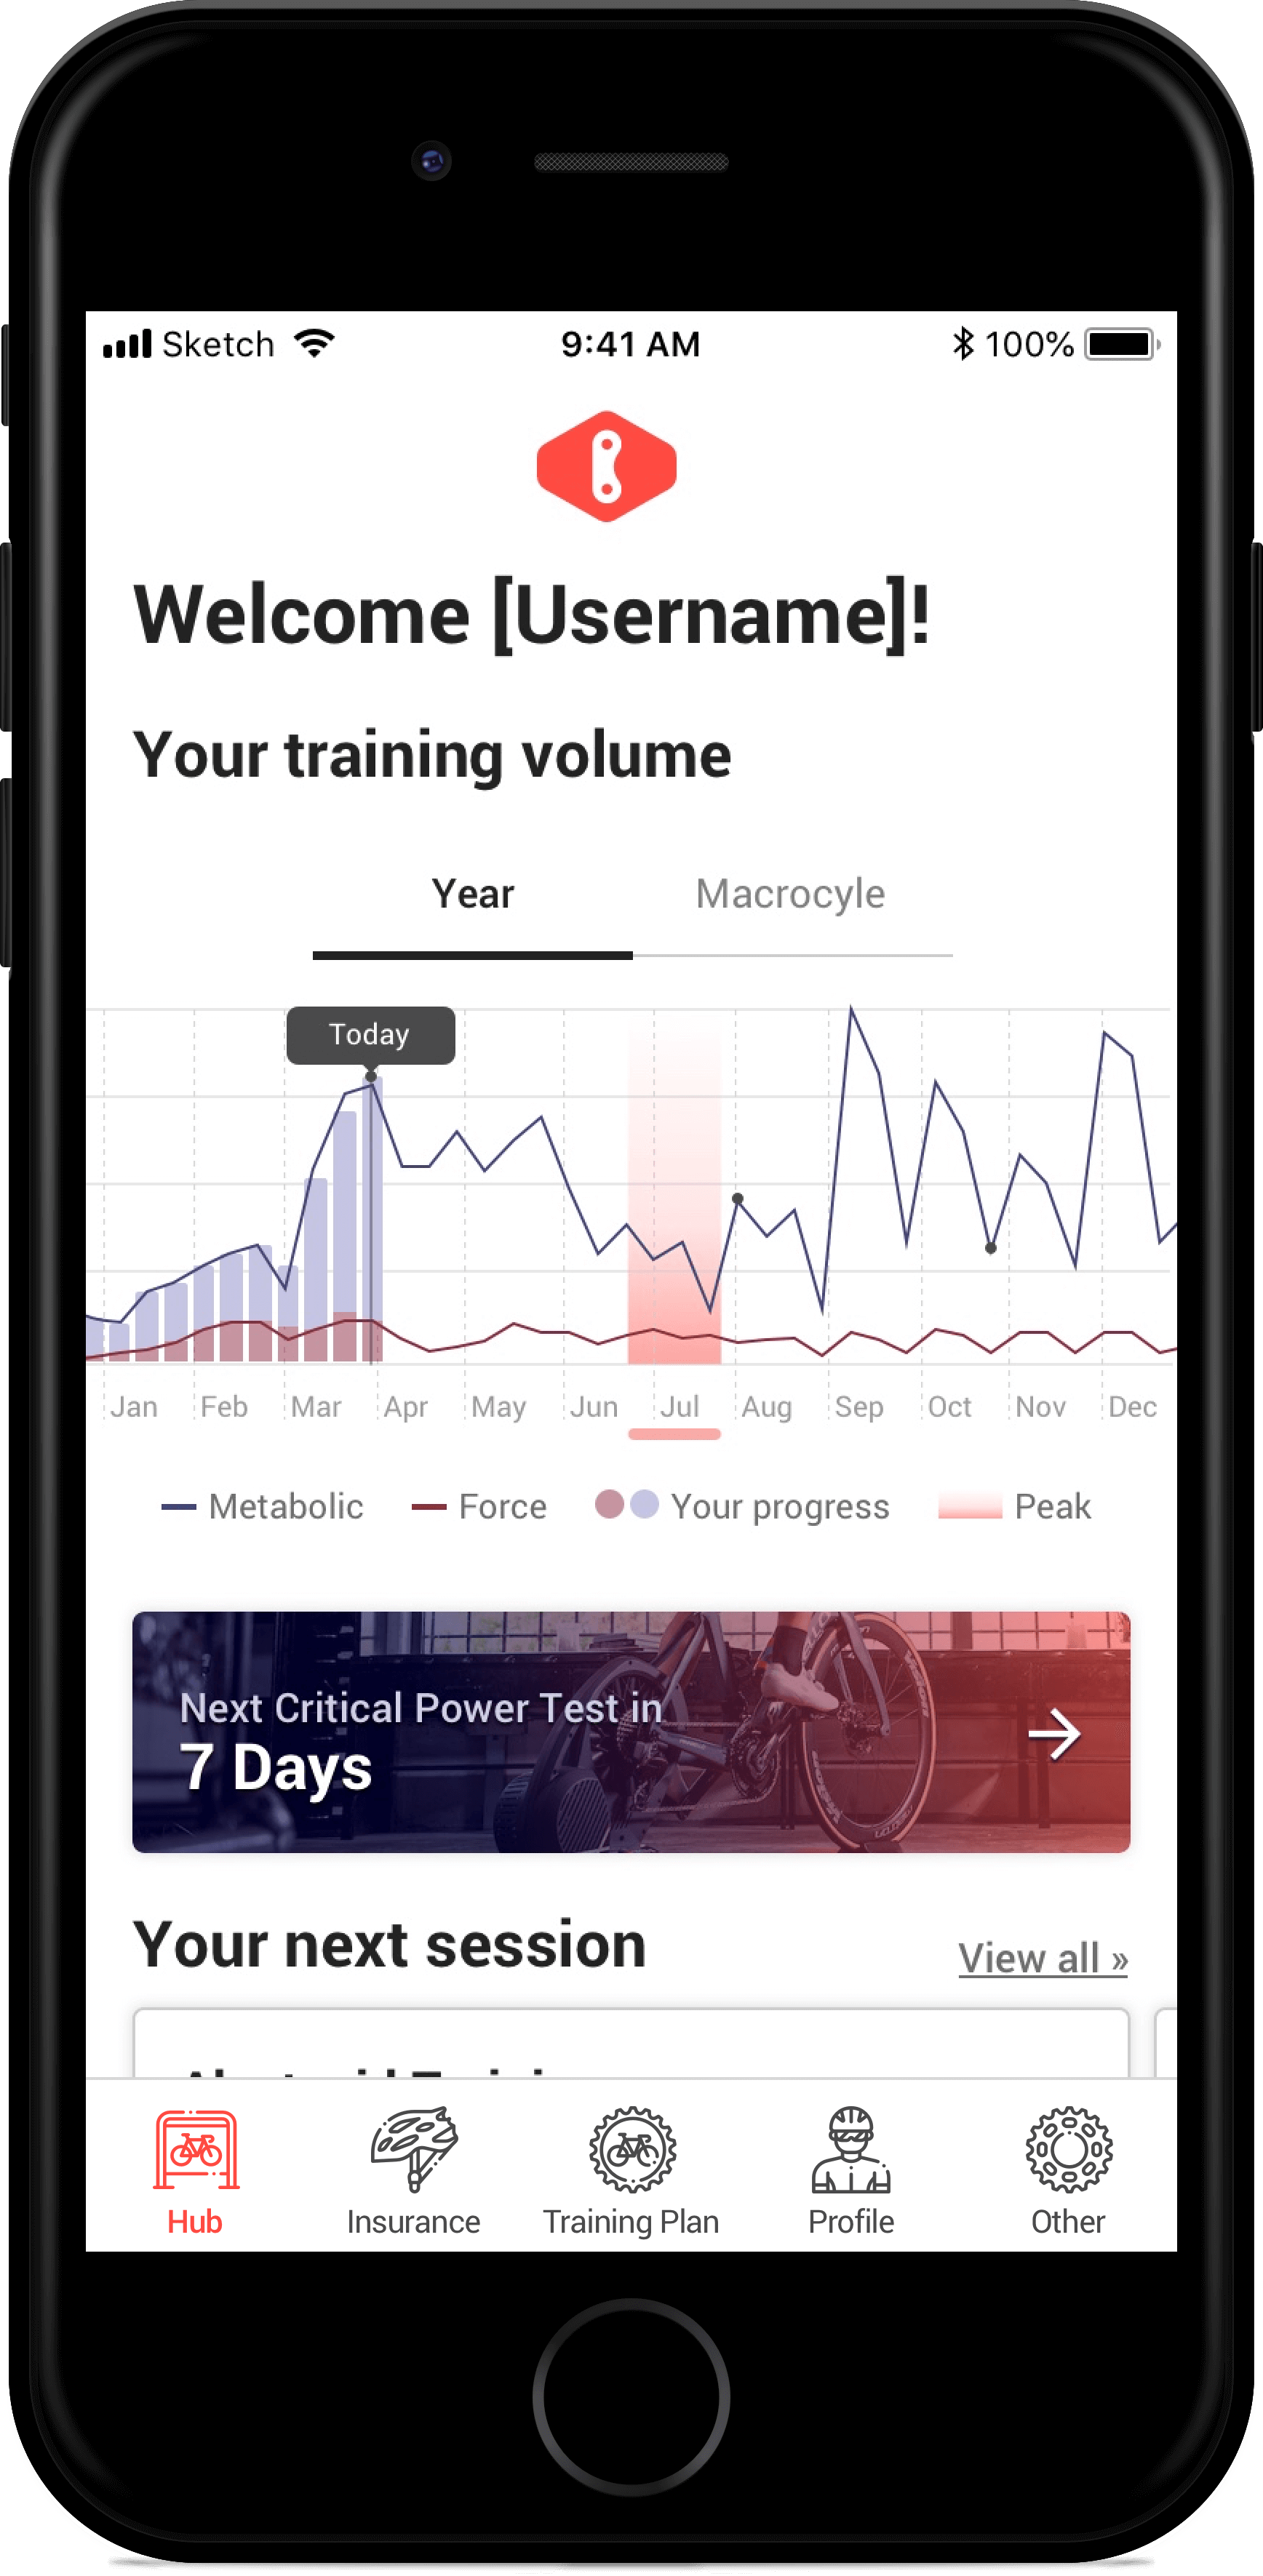
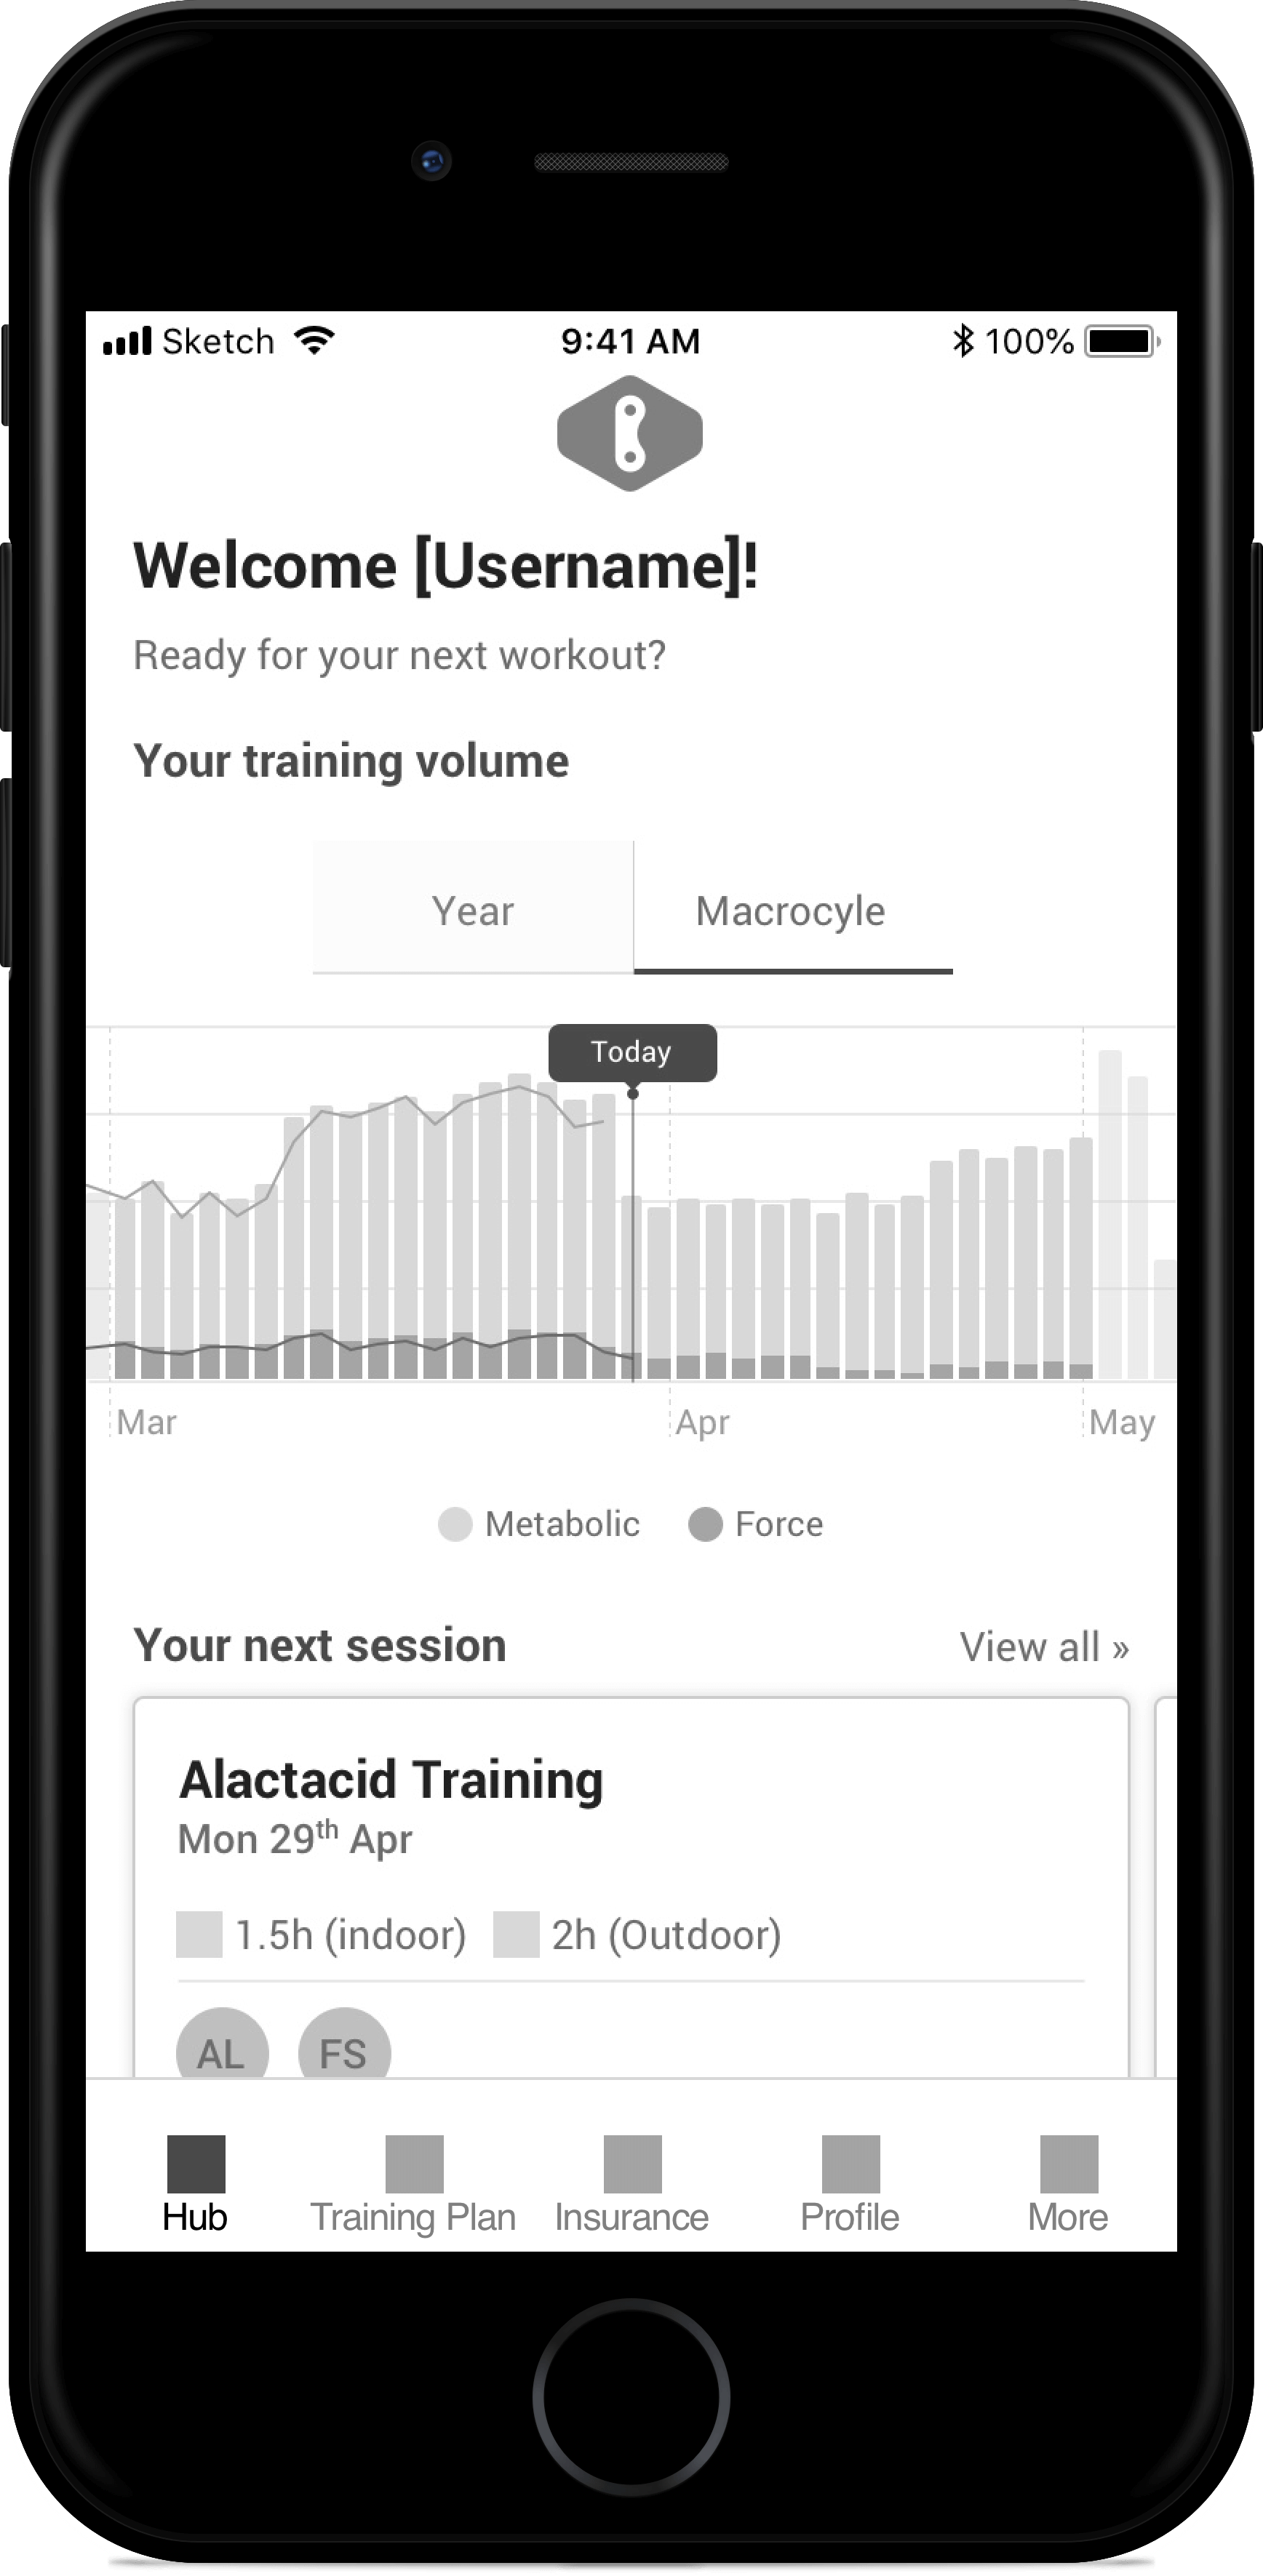
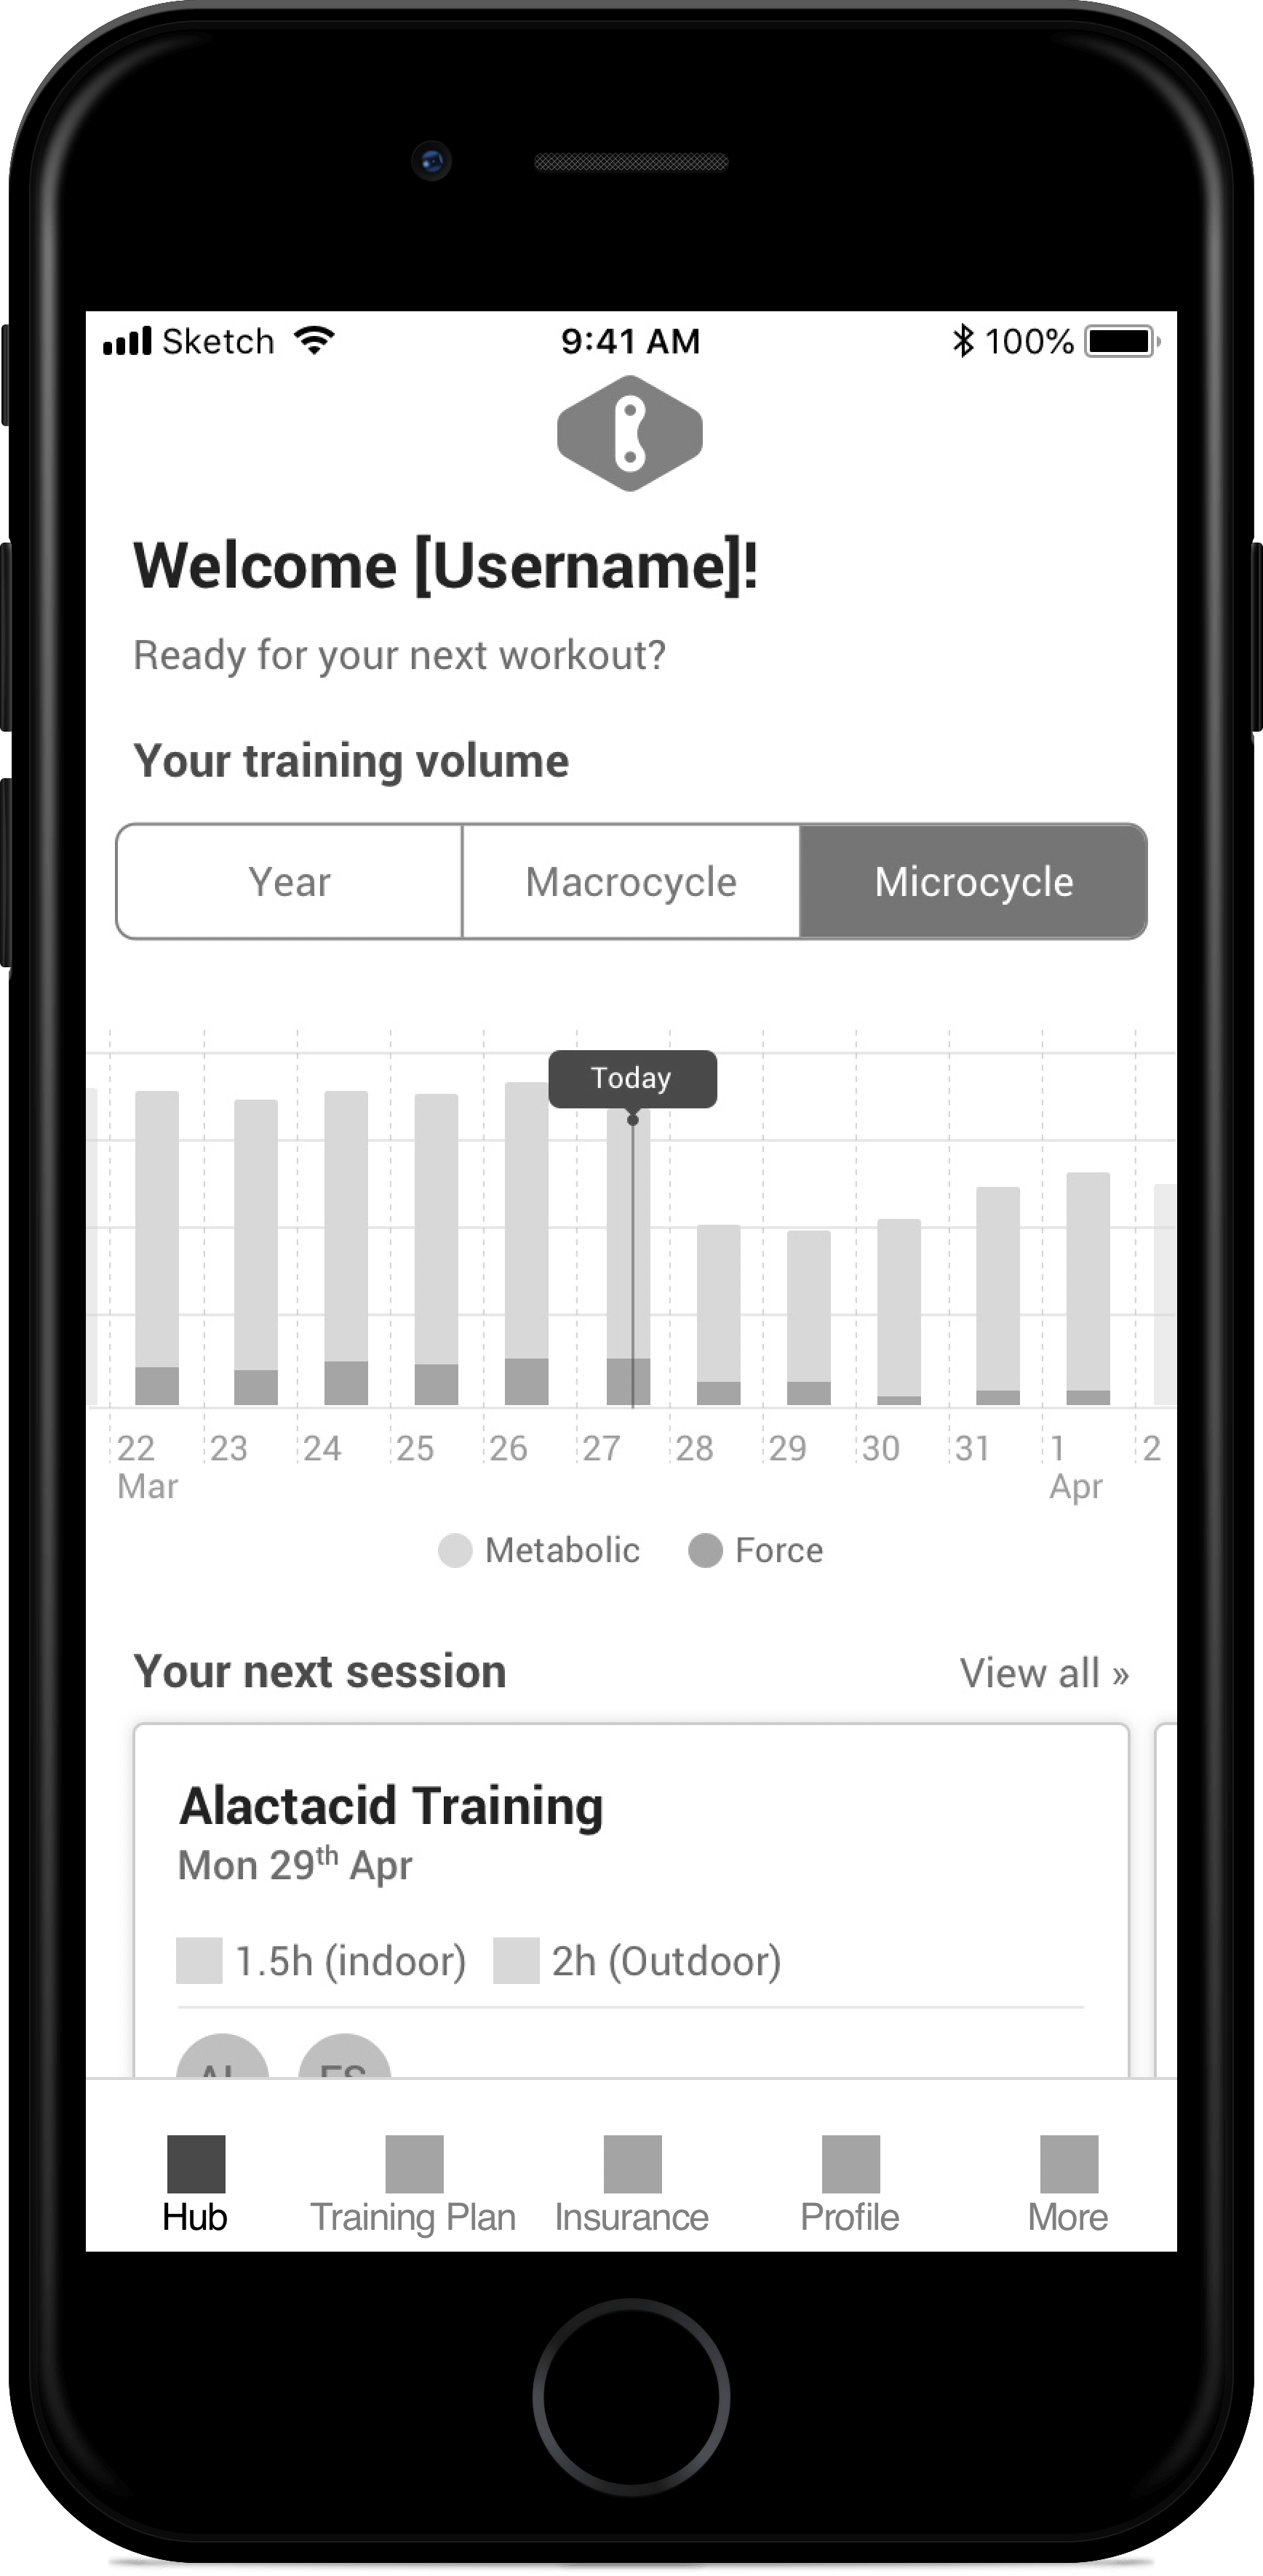
The charts showed on the Hub page are the photograph of your current training situation.
You can switch between the whole year and the current macrocycle (duration of macrocycle depend on the user’s availability).
Each histogram represents a workout (day) executed by the user. The different colors instead, the difference between the expected performance and the performance score earned by the user.
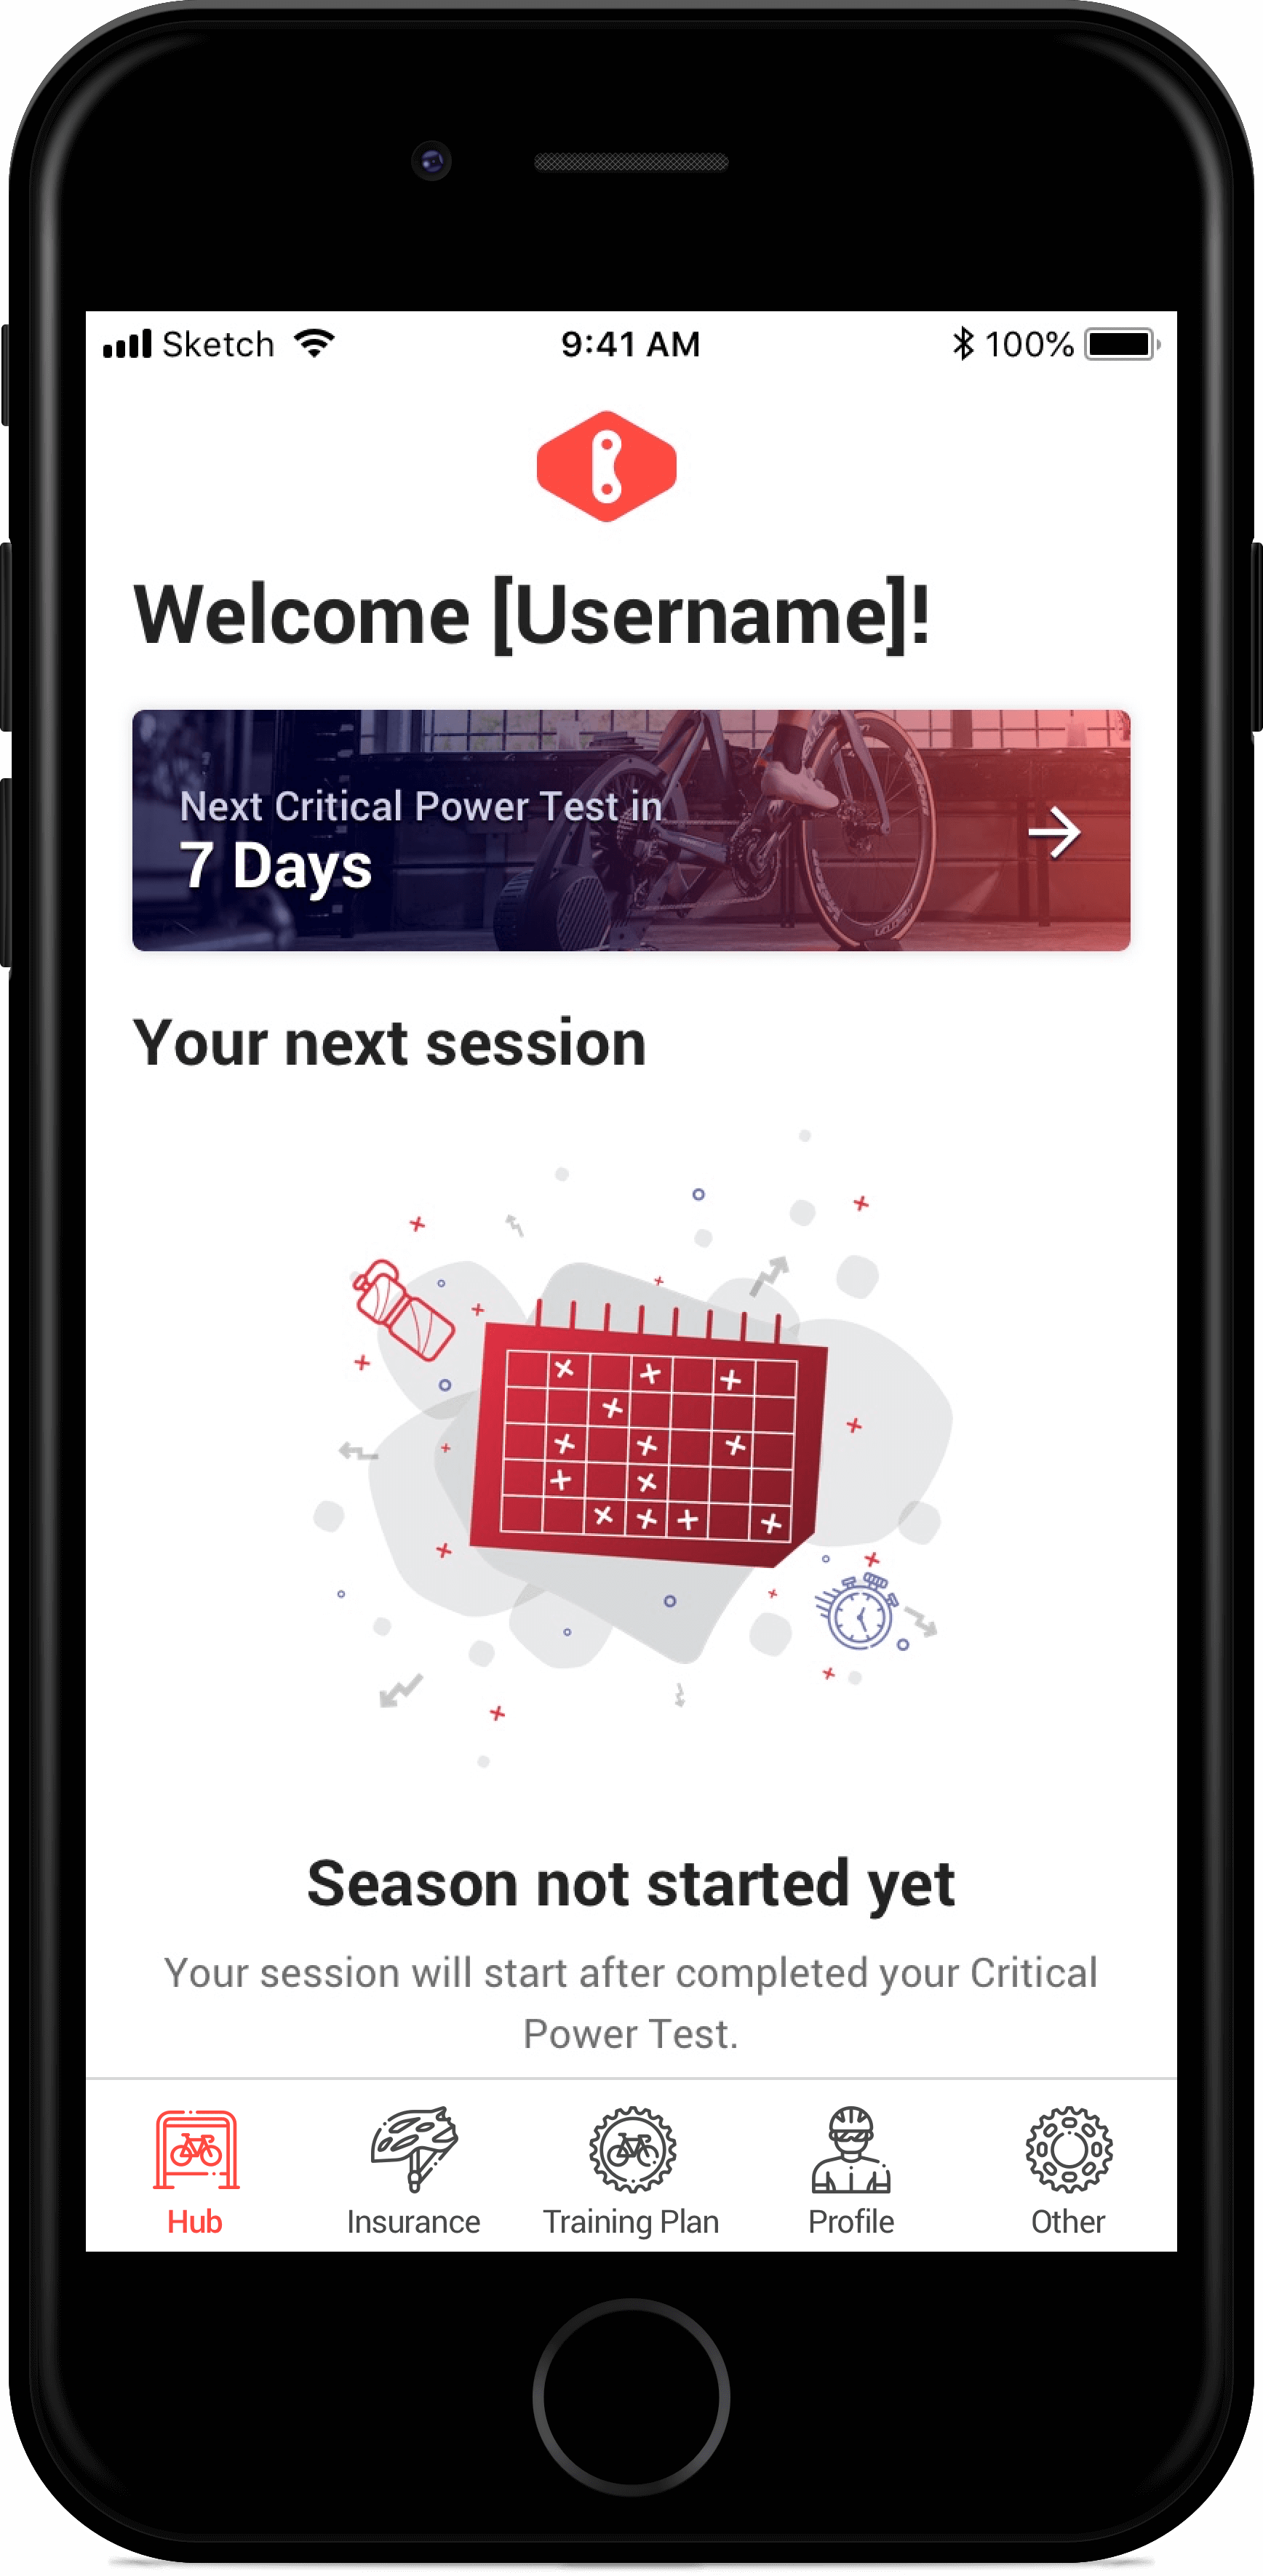
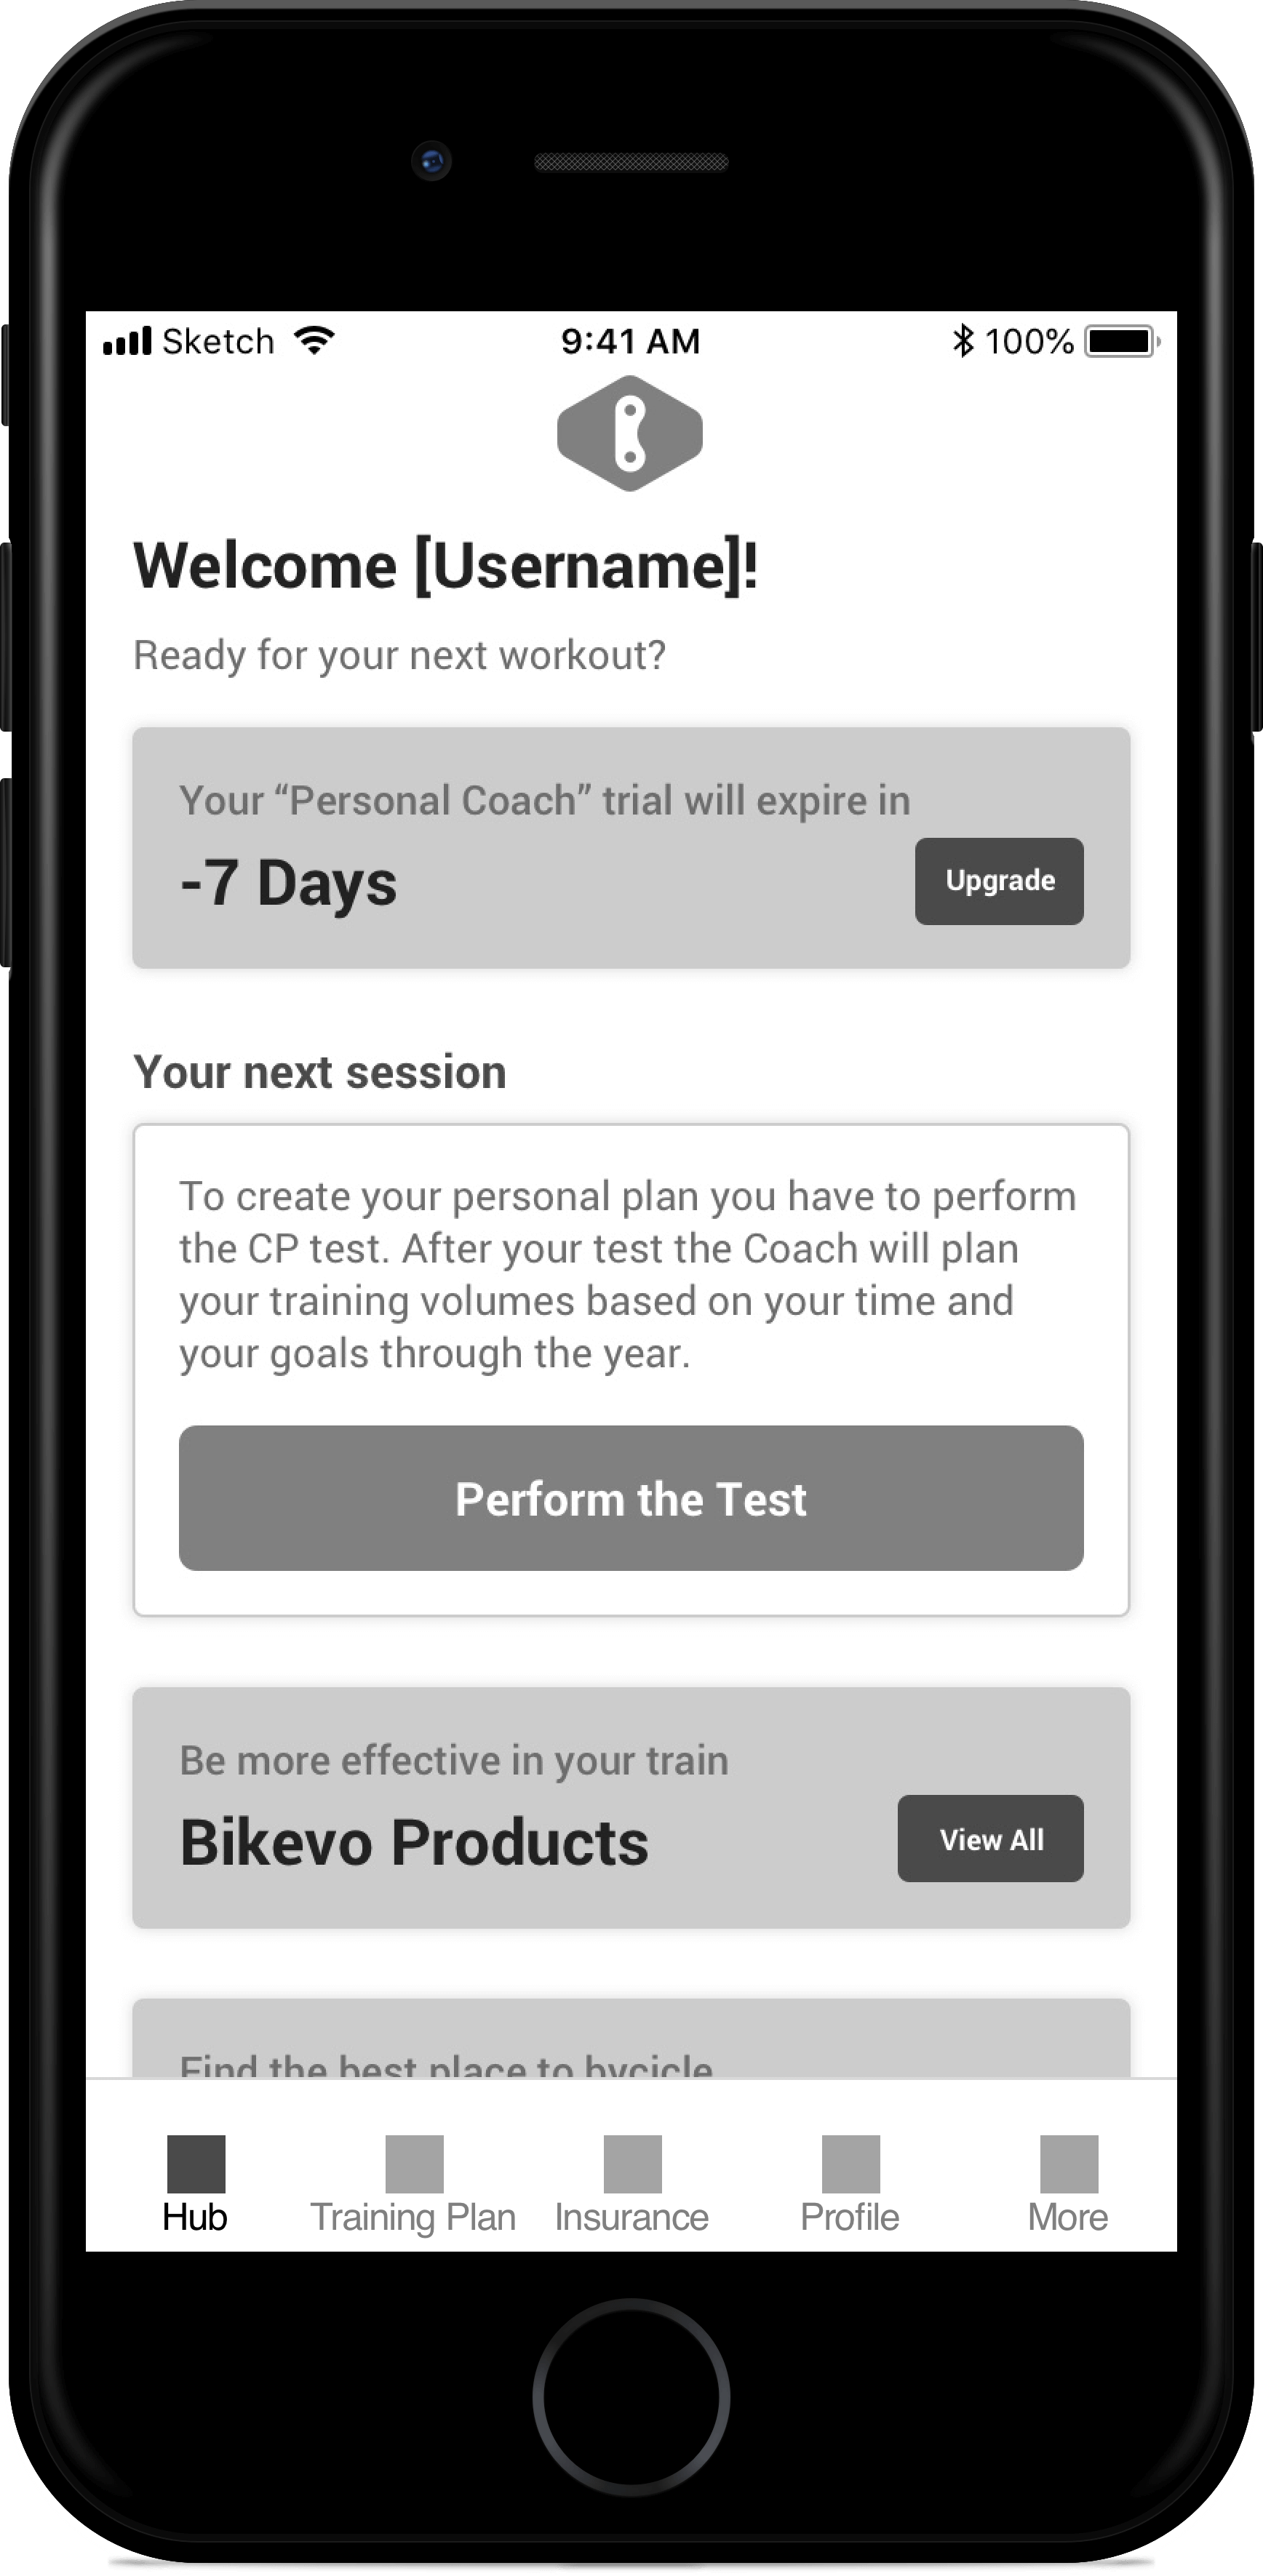
Depending on the product purchased by the user, the hub page could modify the layout.
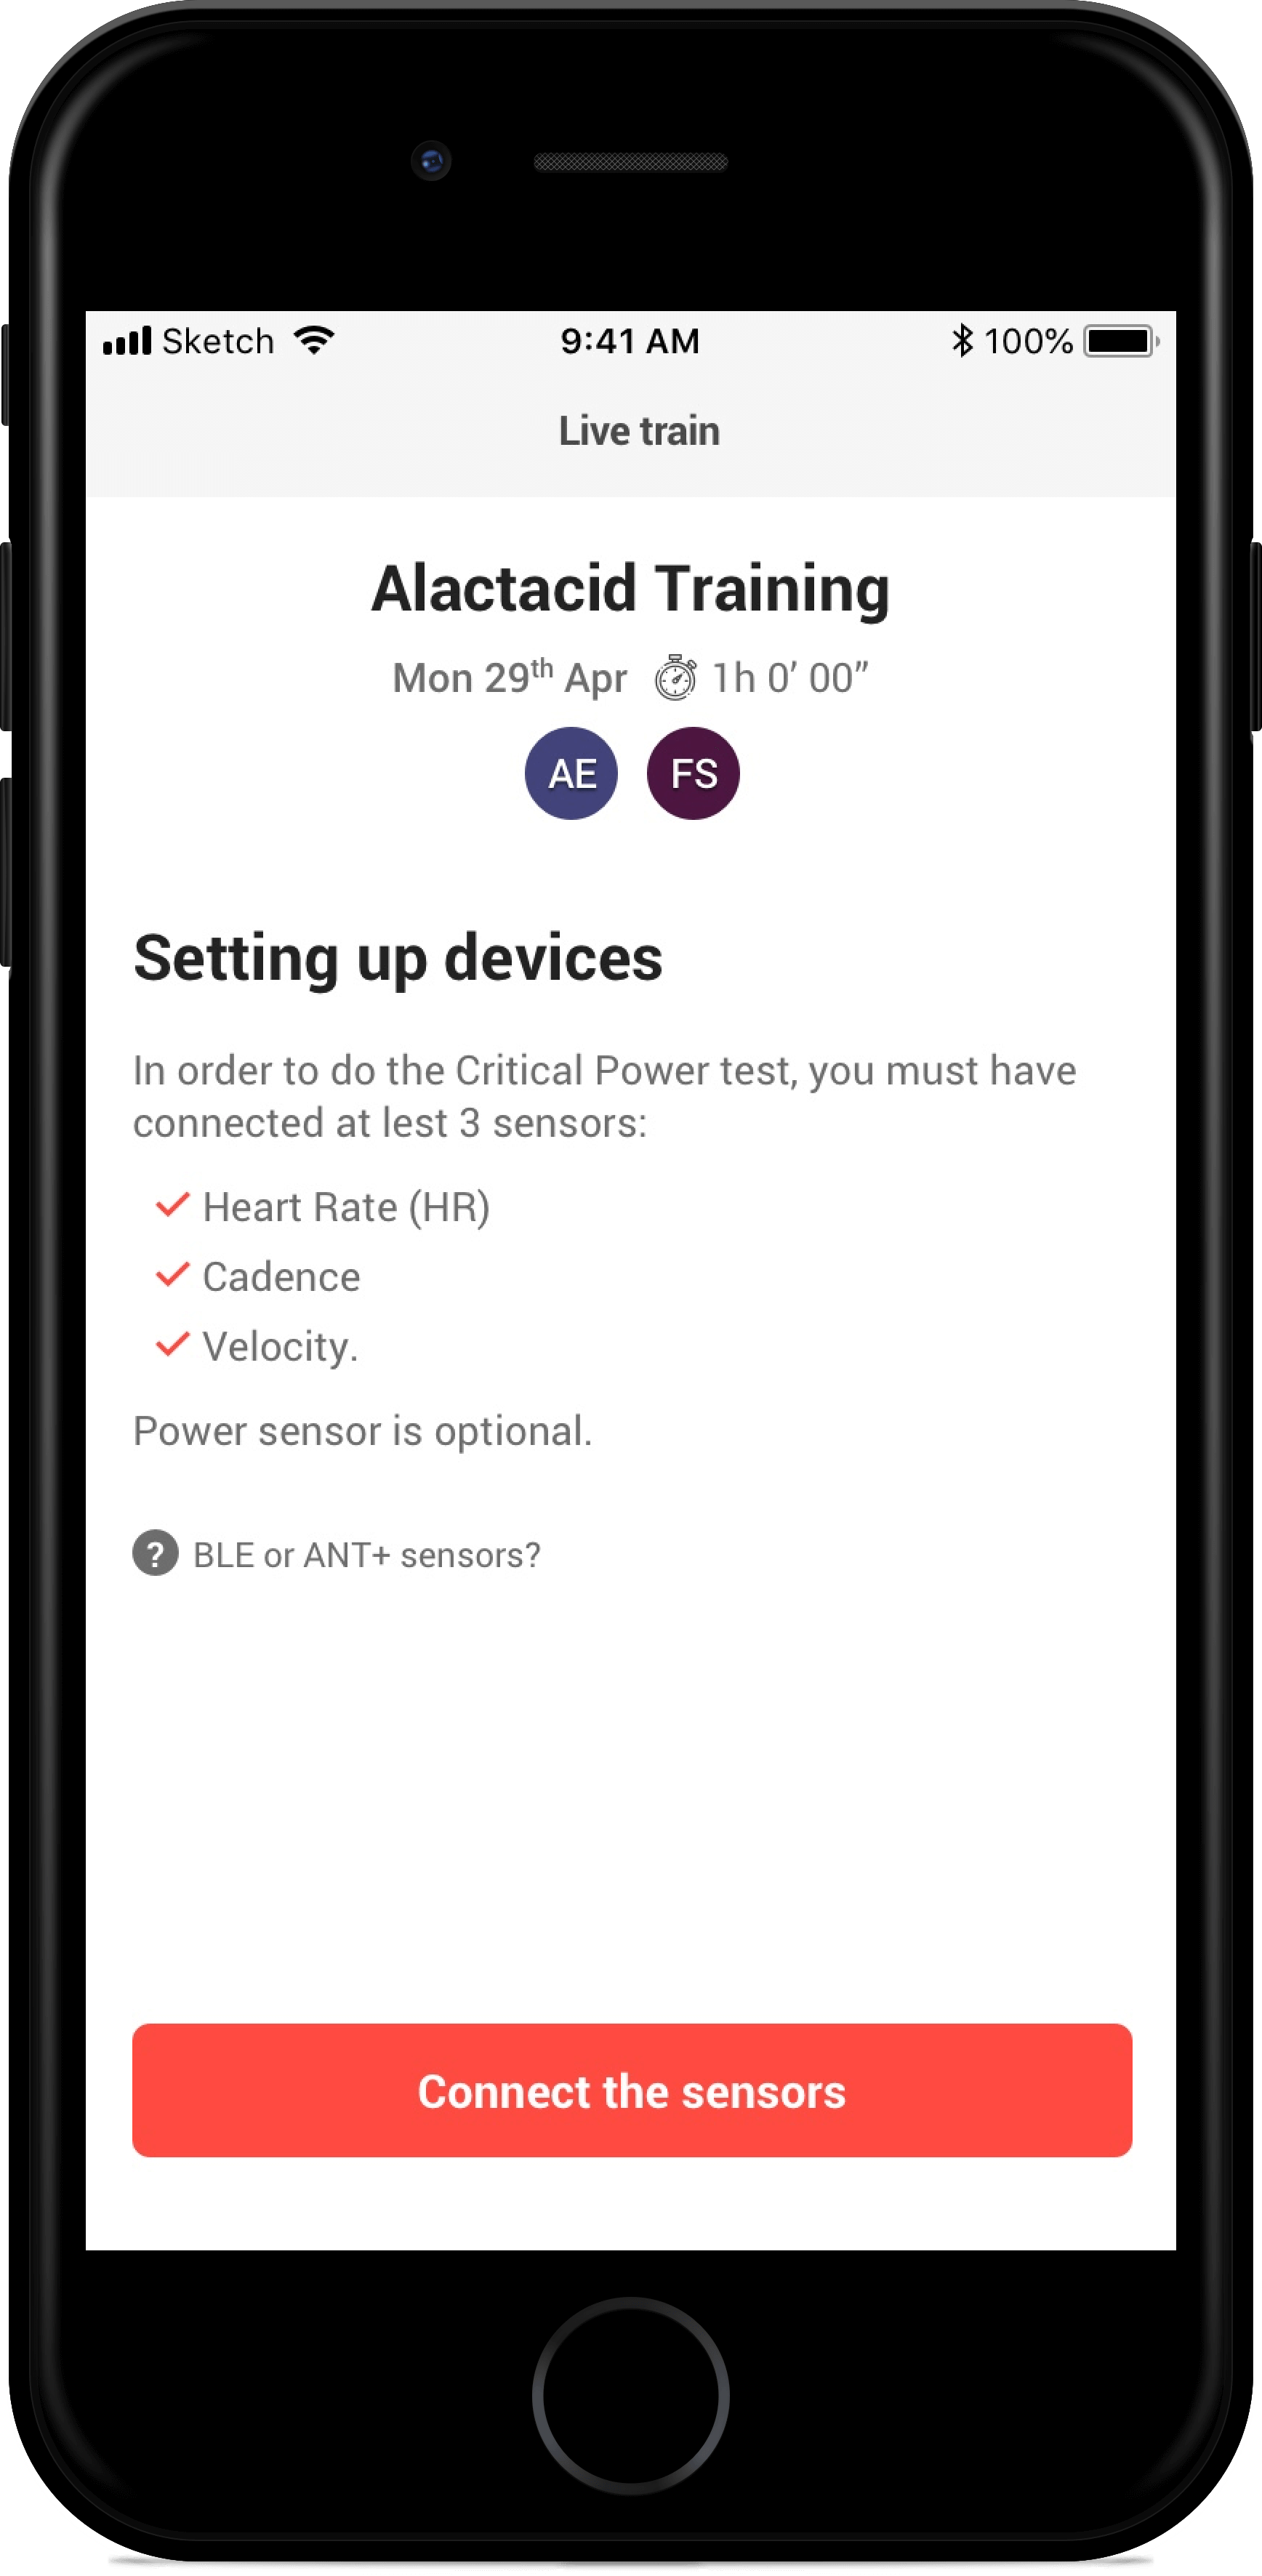
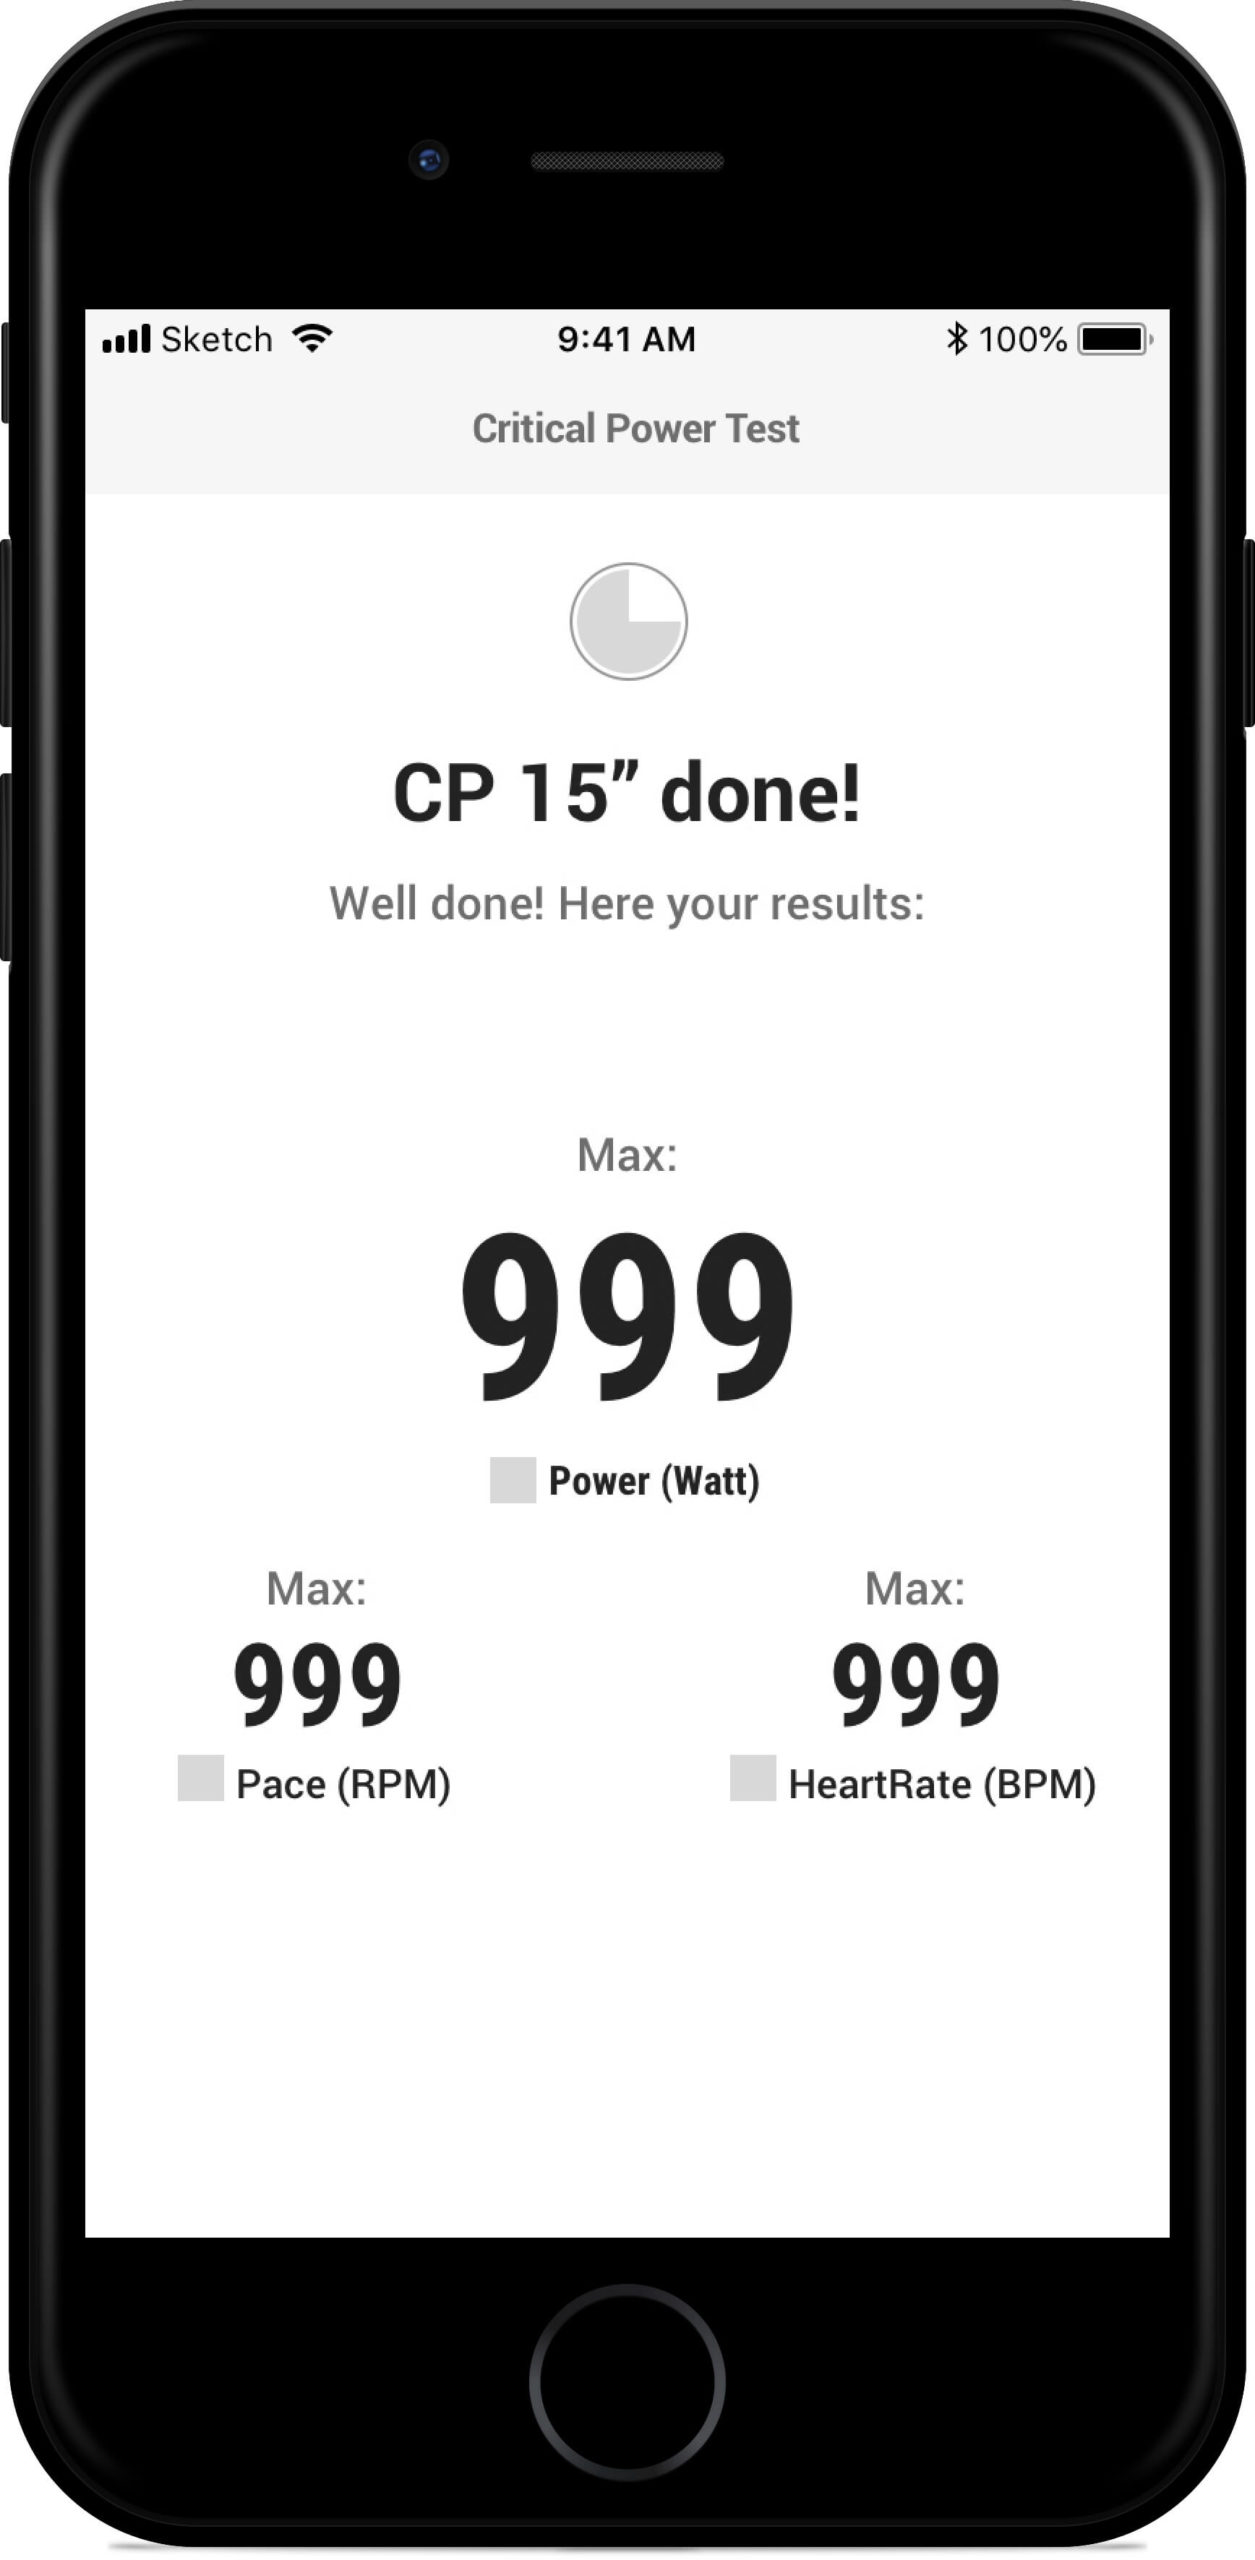
In these last examples, Hub page is showing training videos preview (for whom purchase video training pack) or days remaining to the Critical Power test (for whom purchase just the Tests pack)
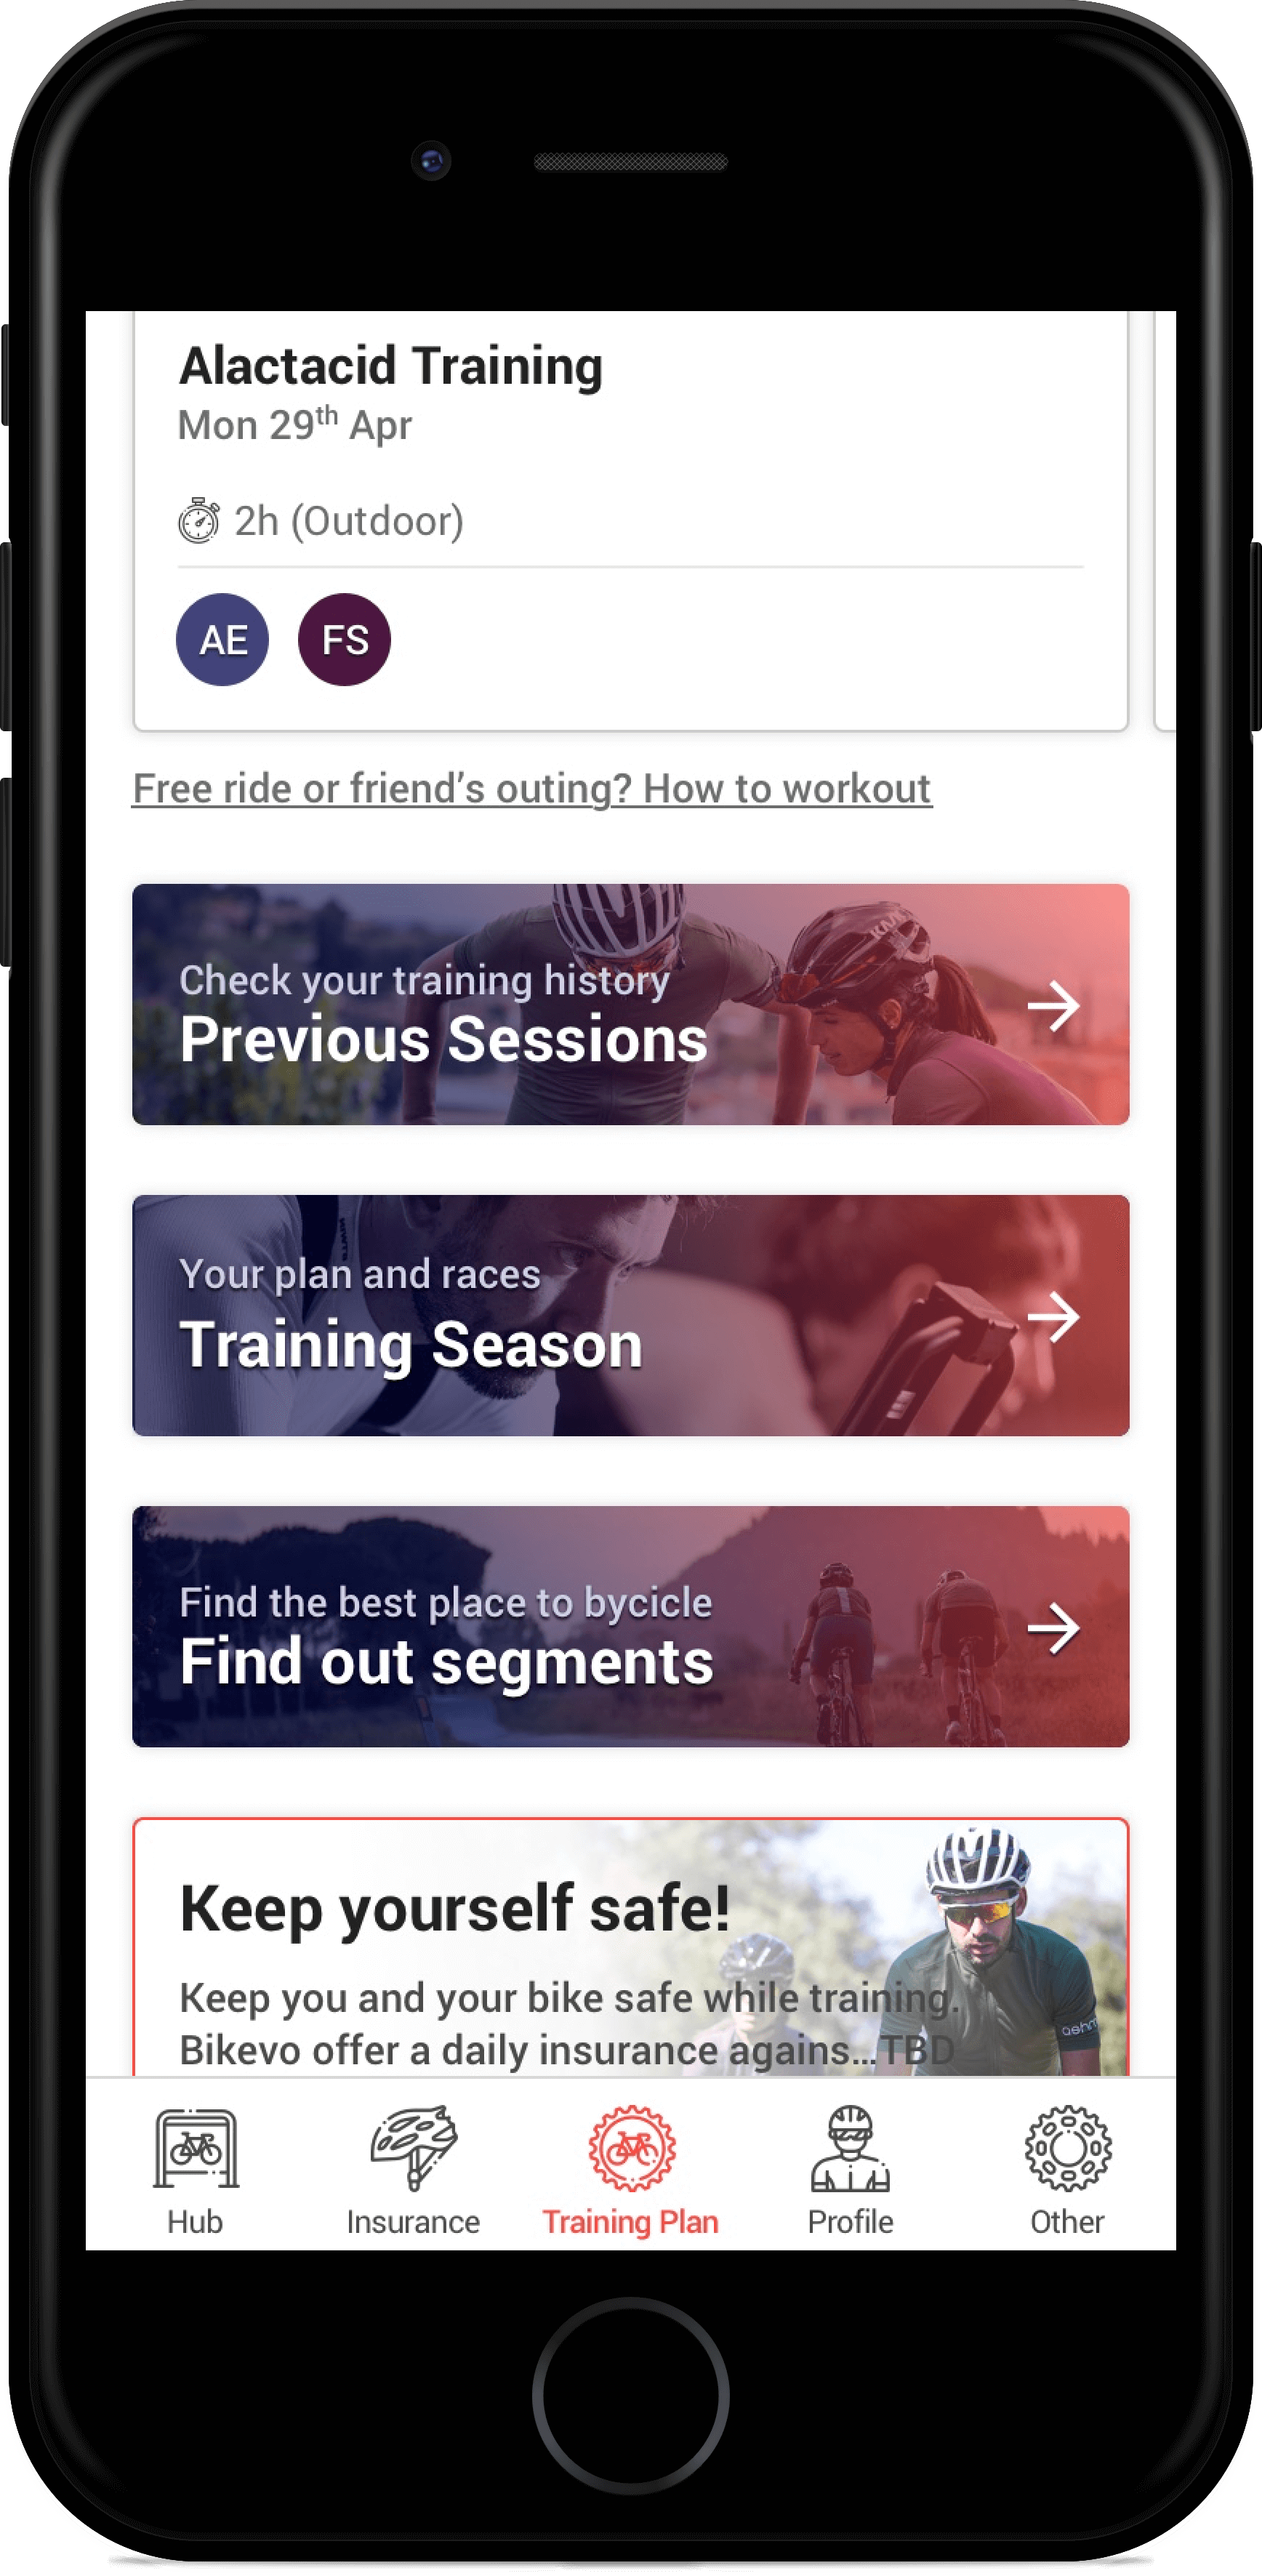
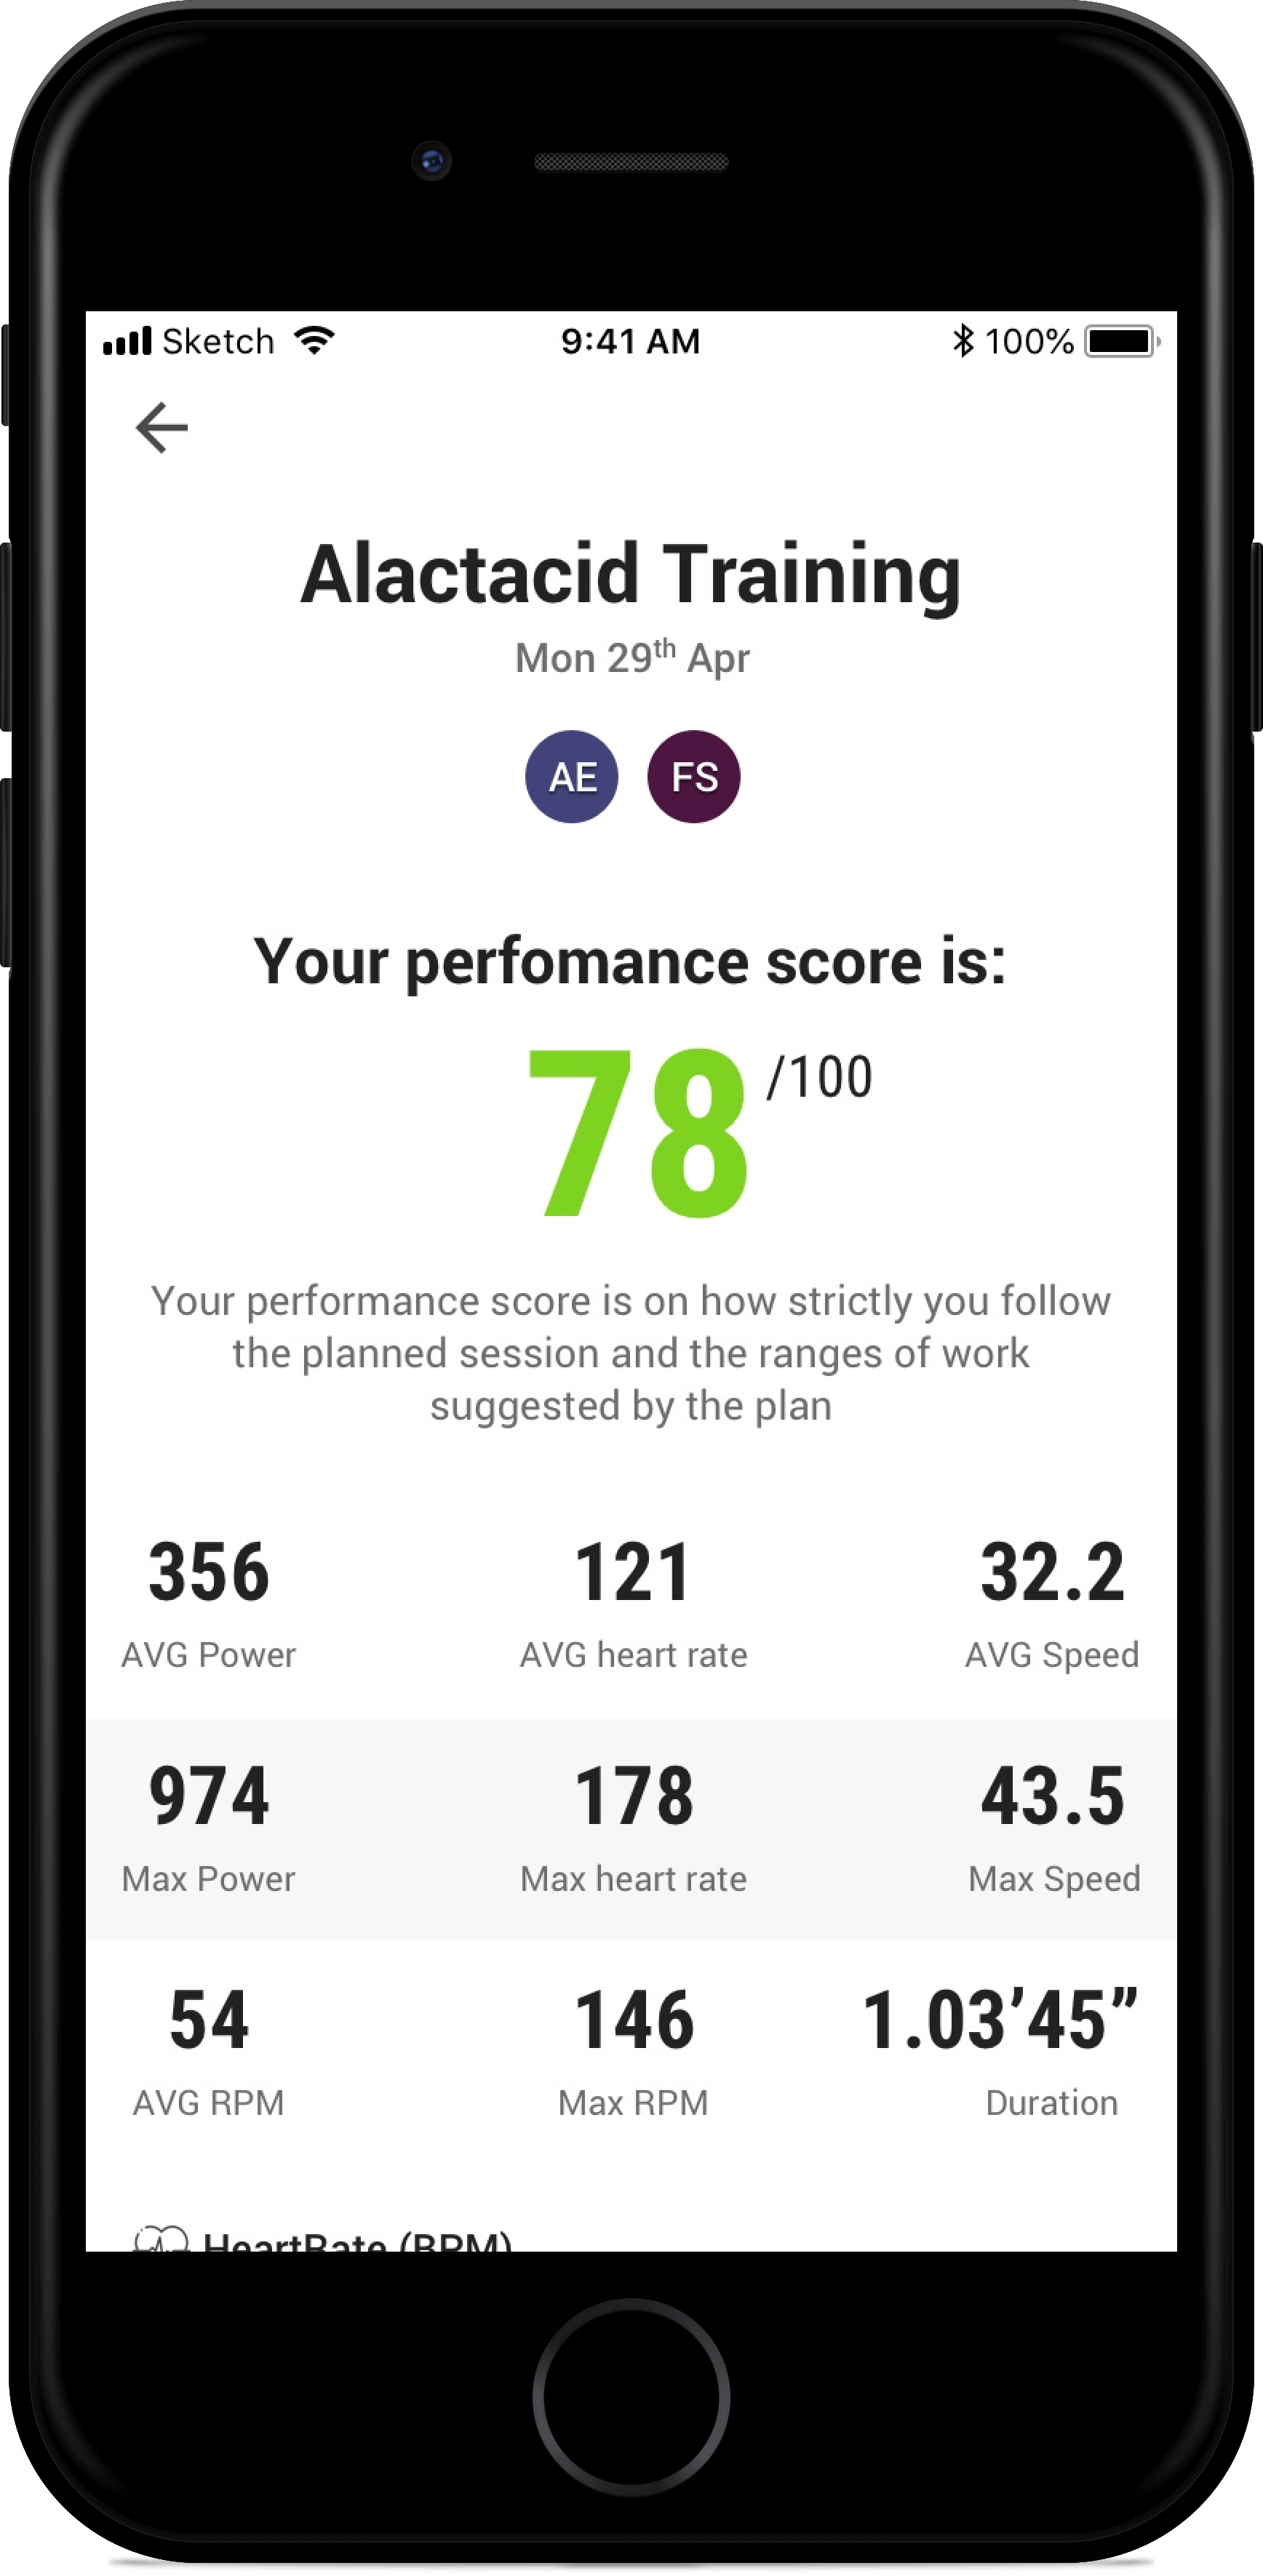
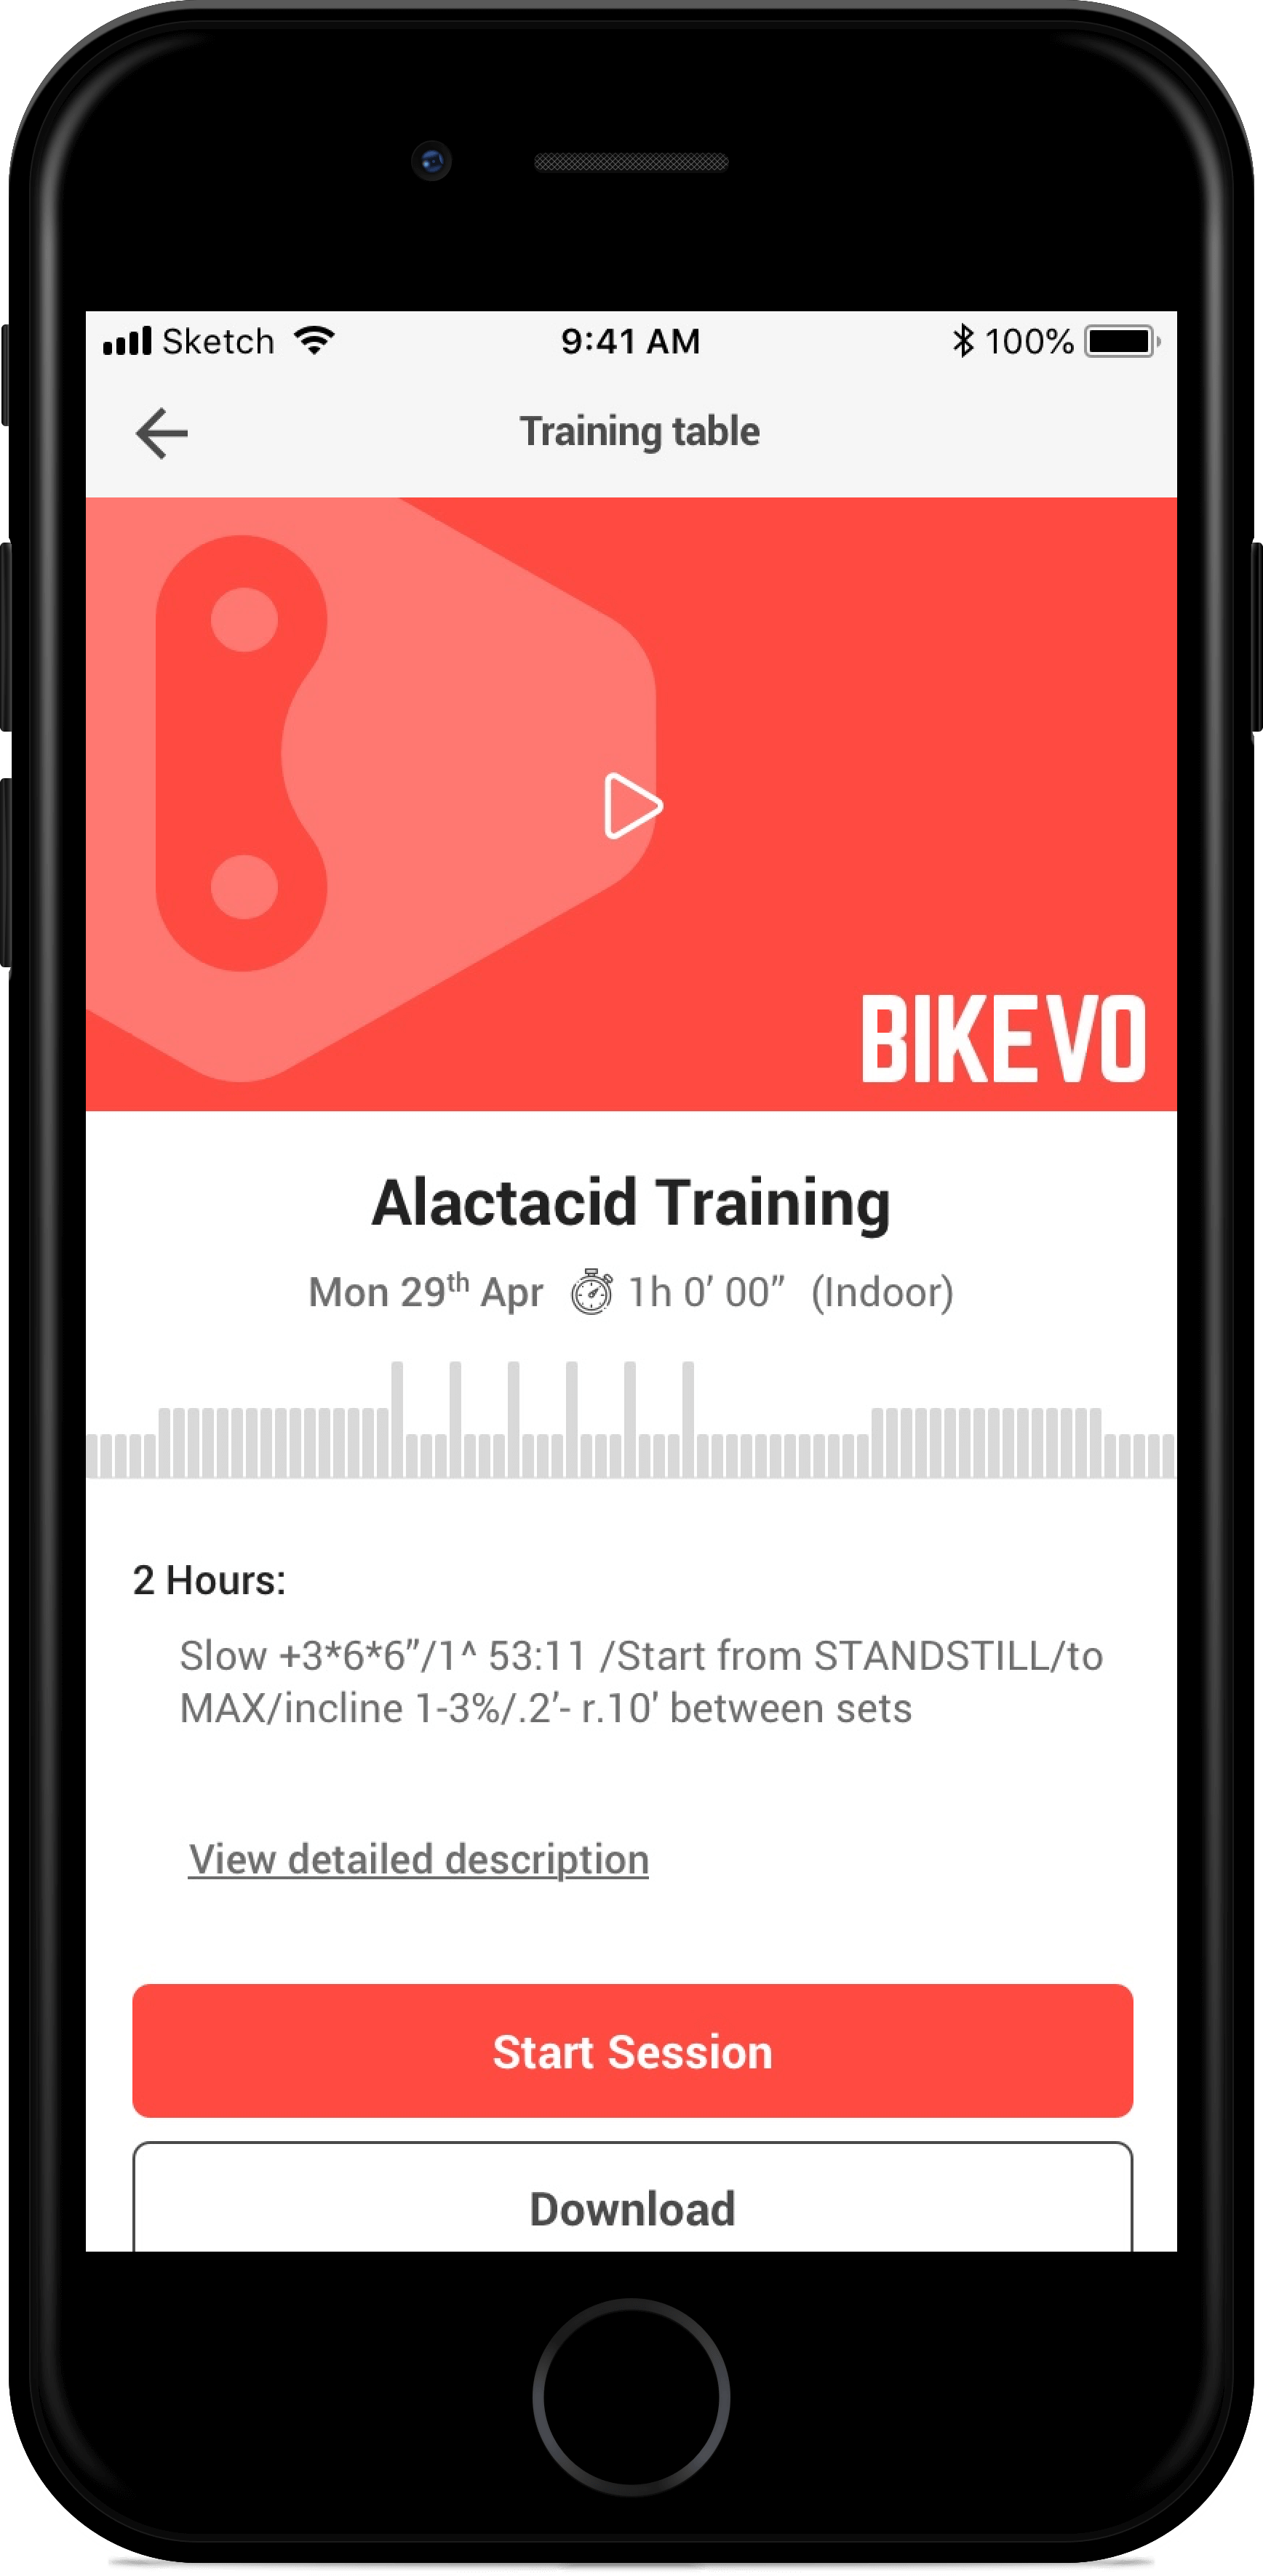
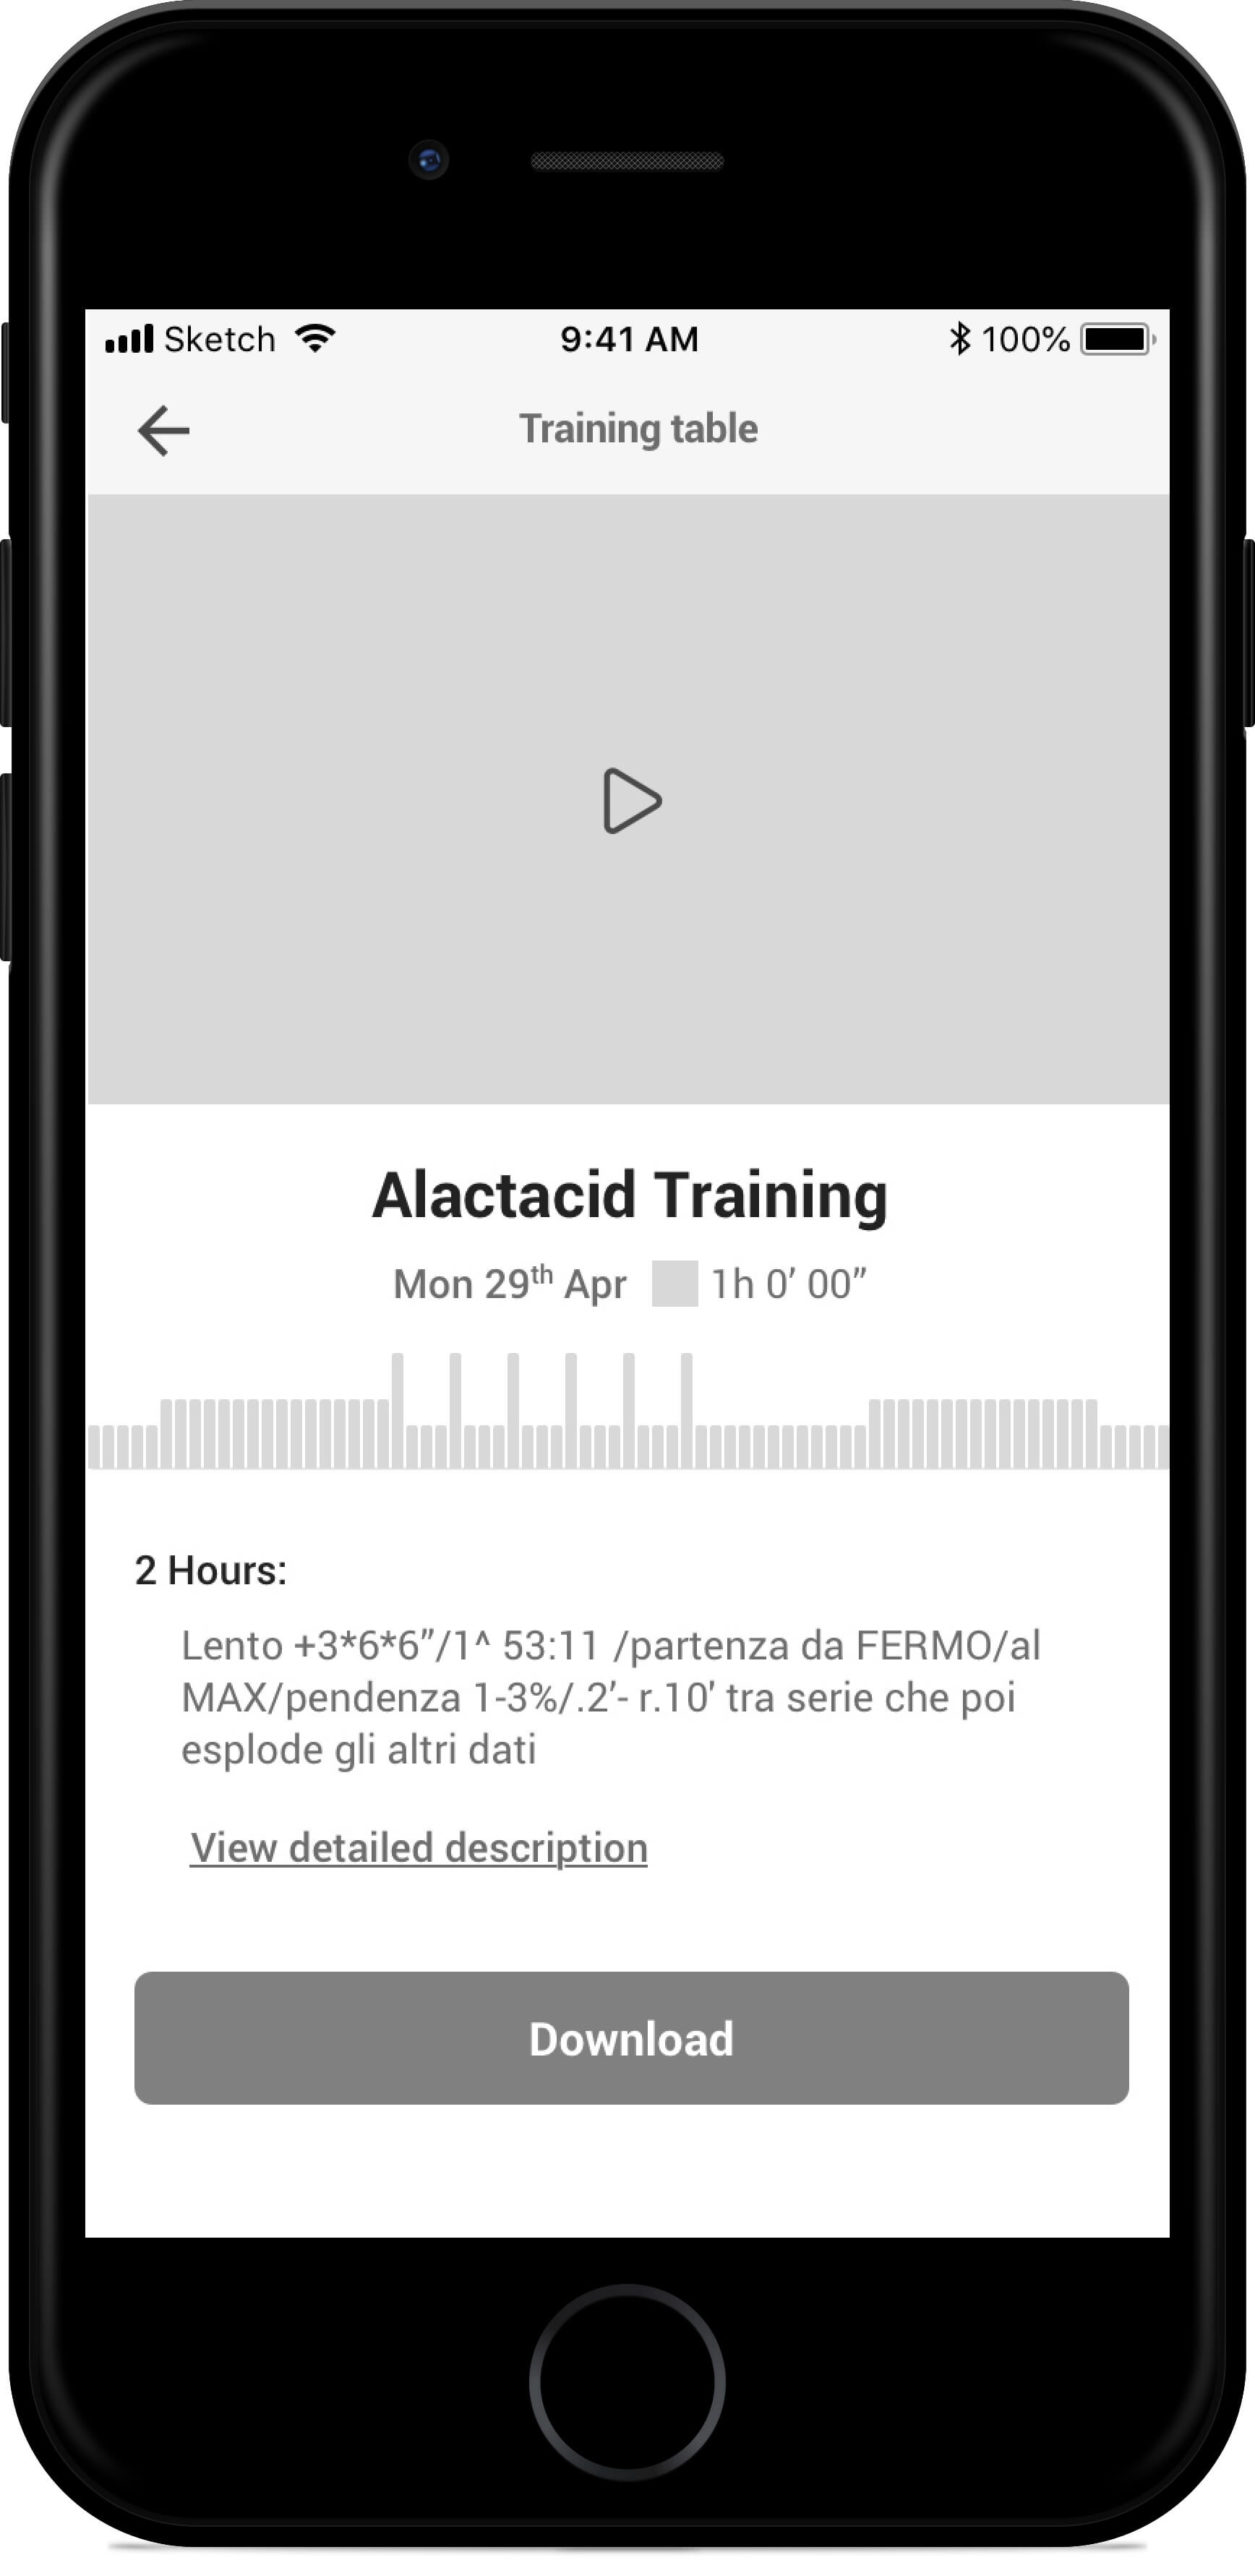
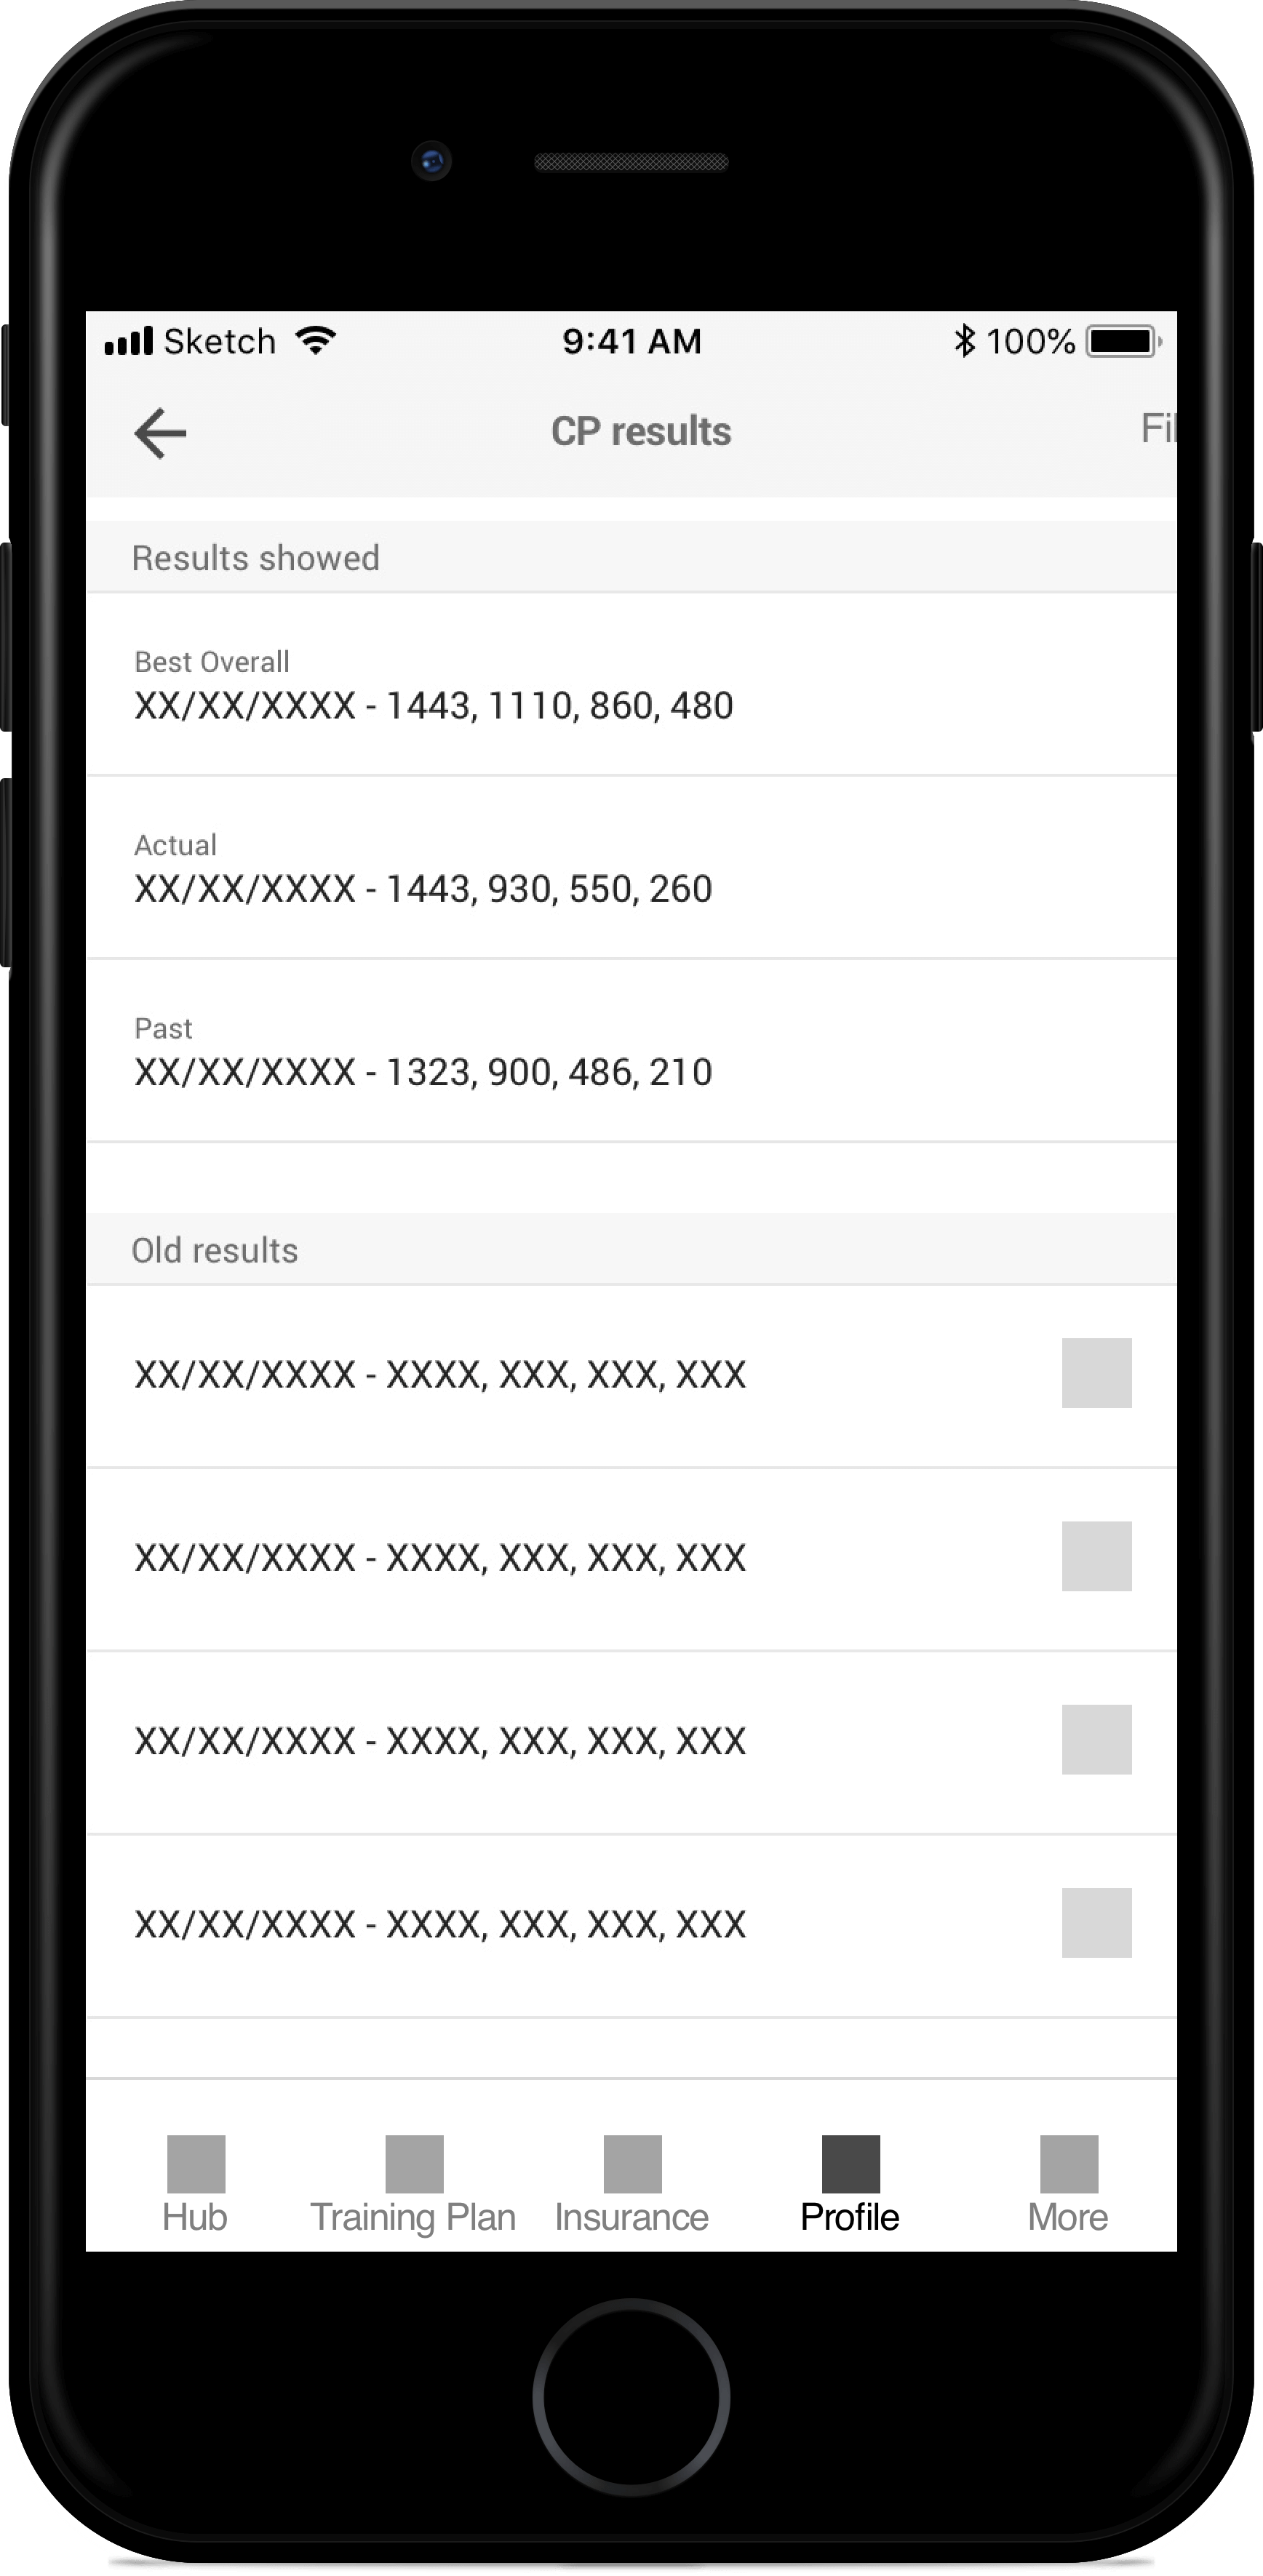
The “training plan” page is the page in which the user could find all the information related to workouts: check the actual training cycle, starting a new session, check past results, manage his availability, find the best segment close to him, etc.
The goal of the page is to give the user complete control and understanding of his training plan.
Also, this page is modular and card-based. It has few versions than the hub page depending on the part of the plan user is facing.
Training Plan
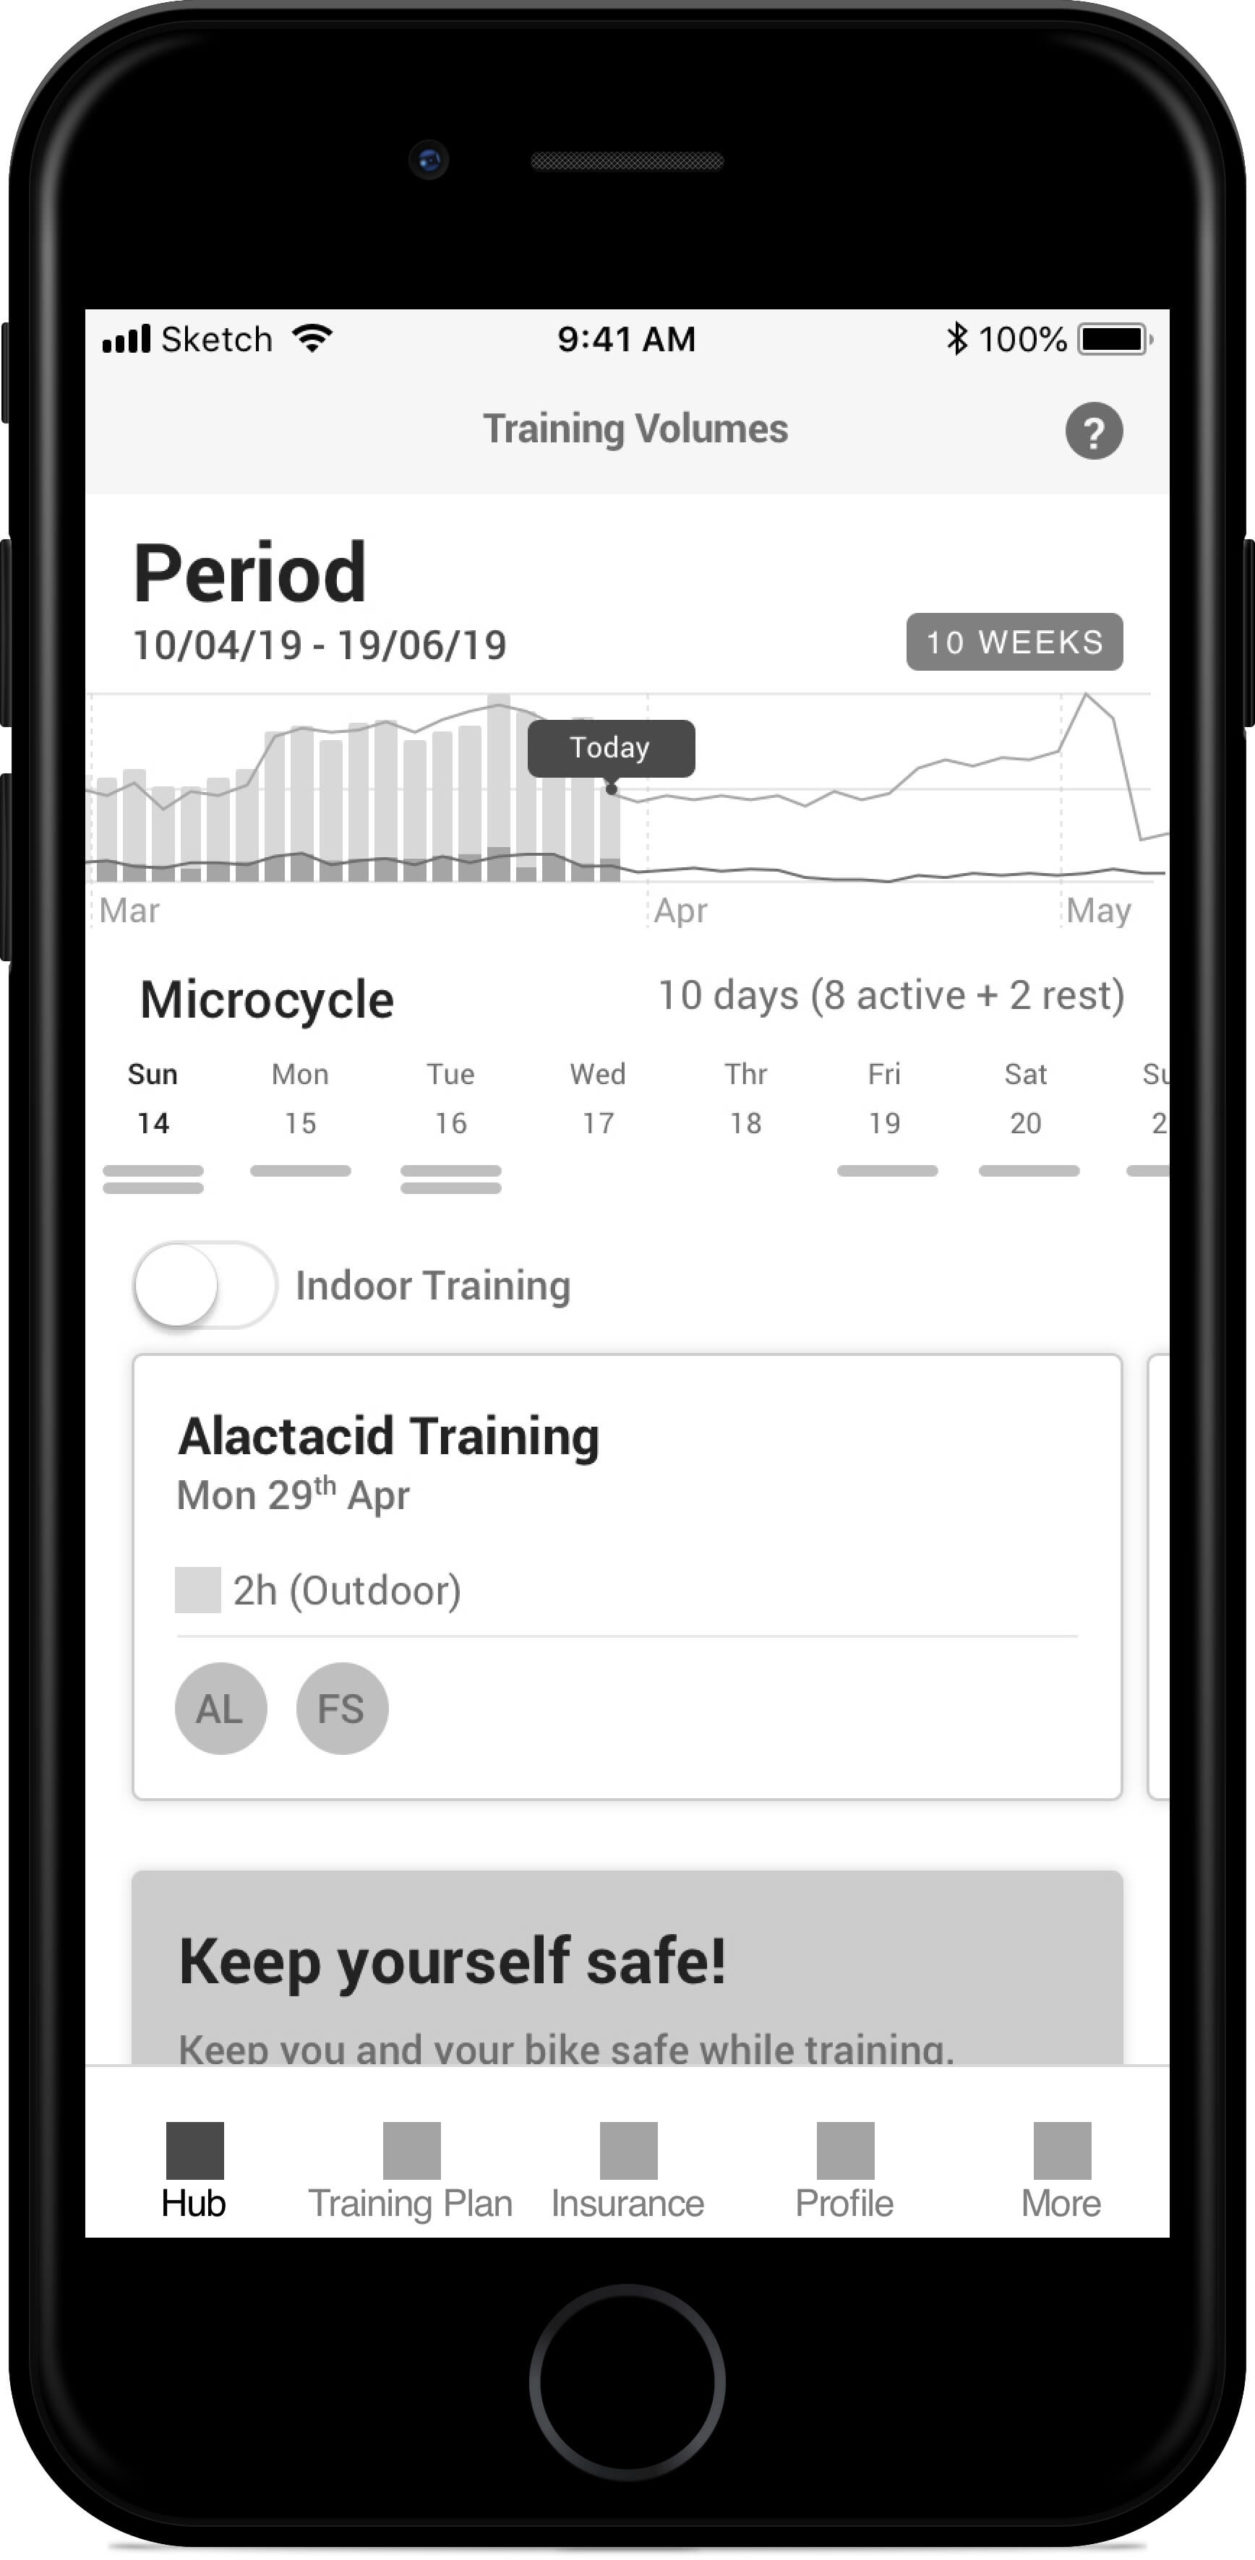
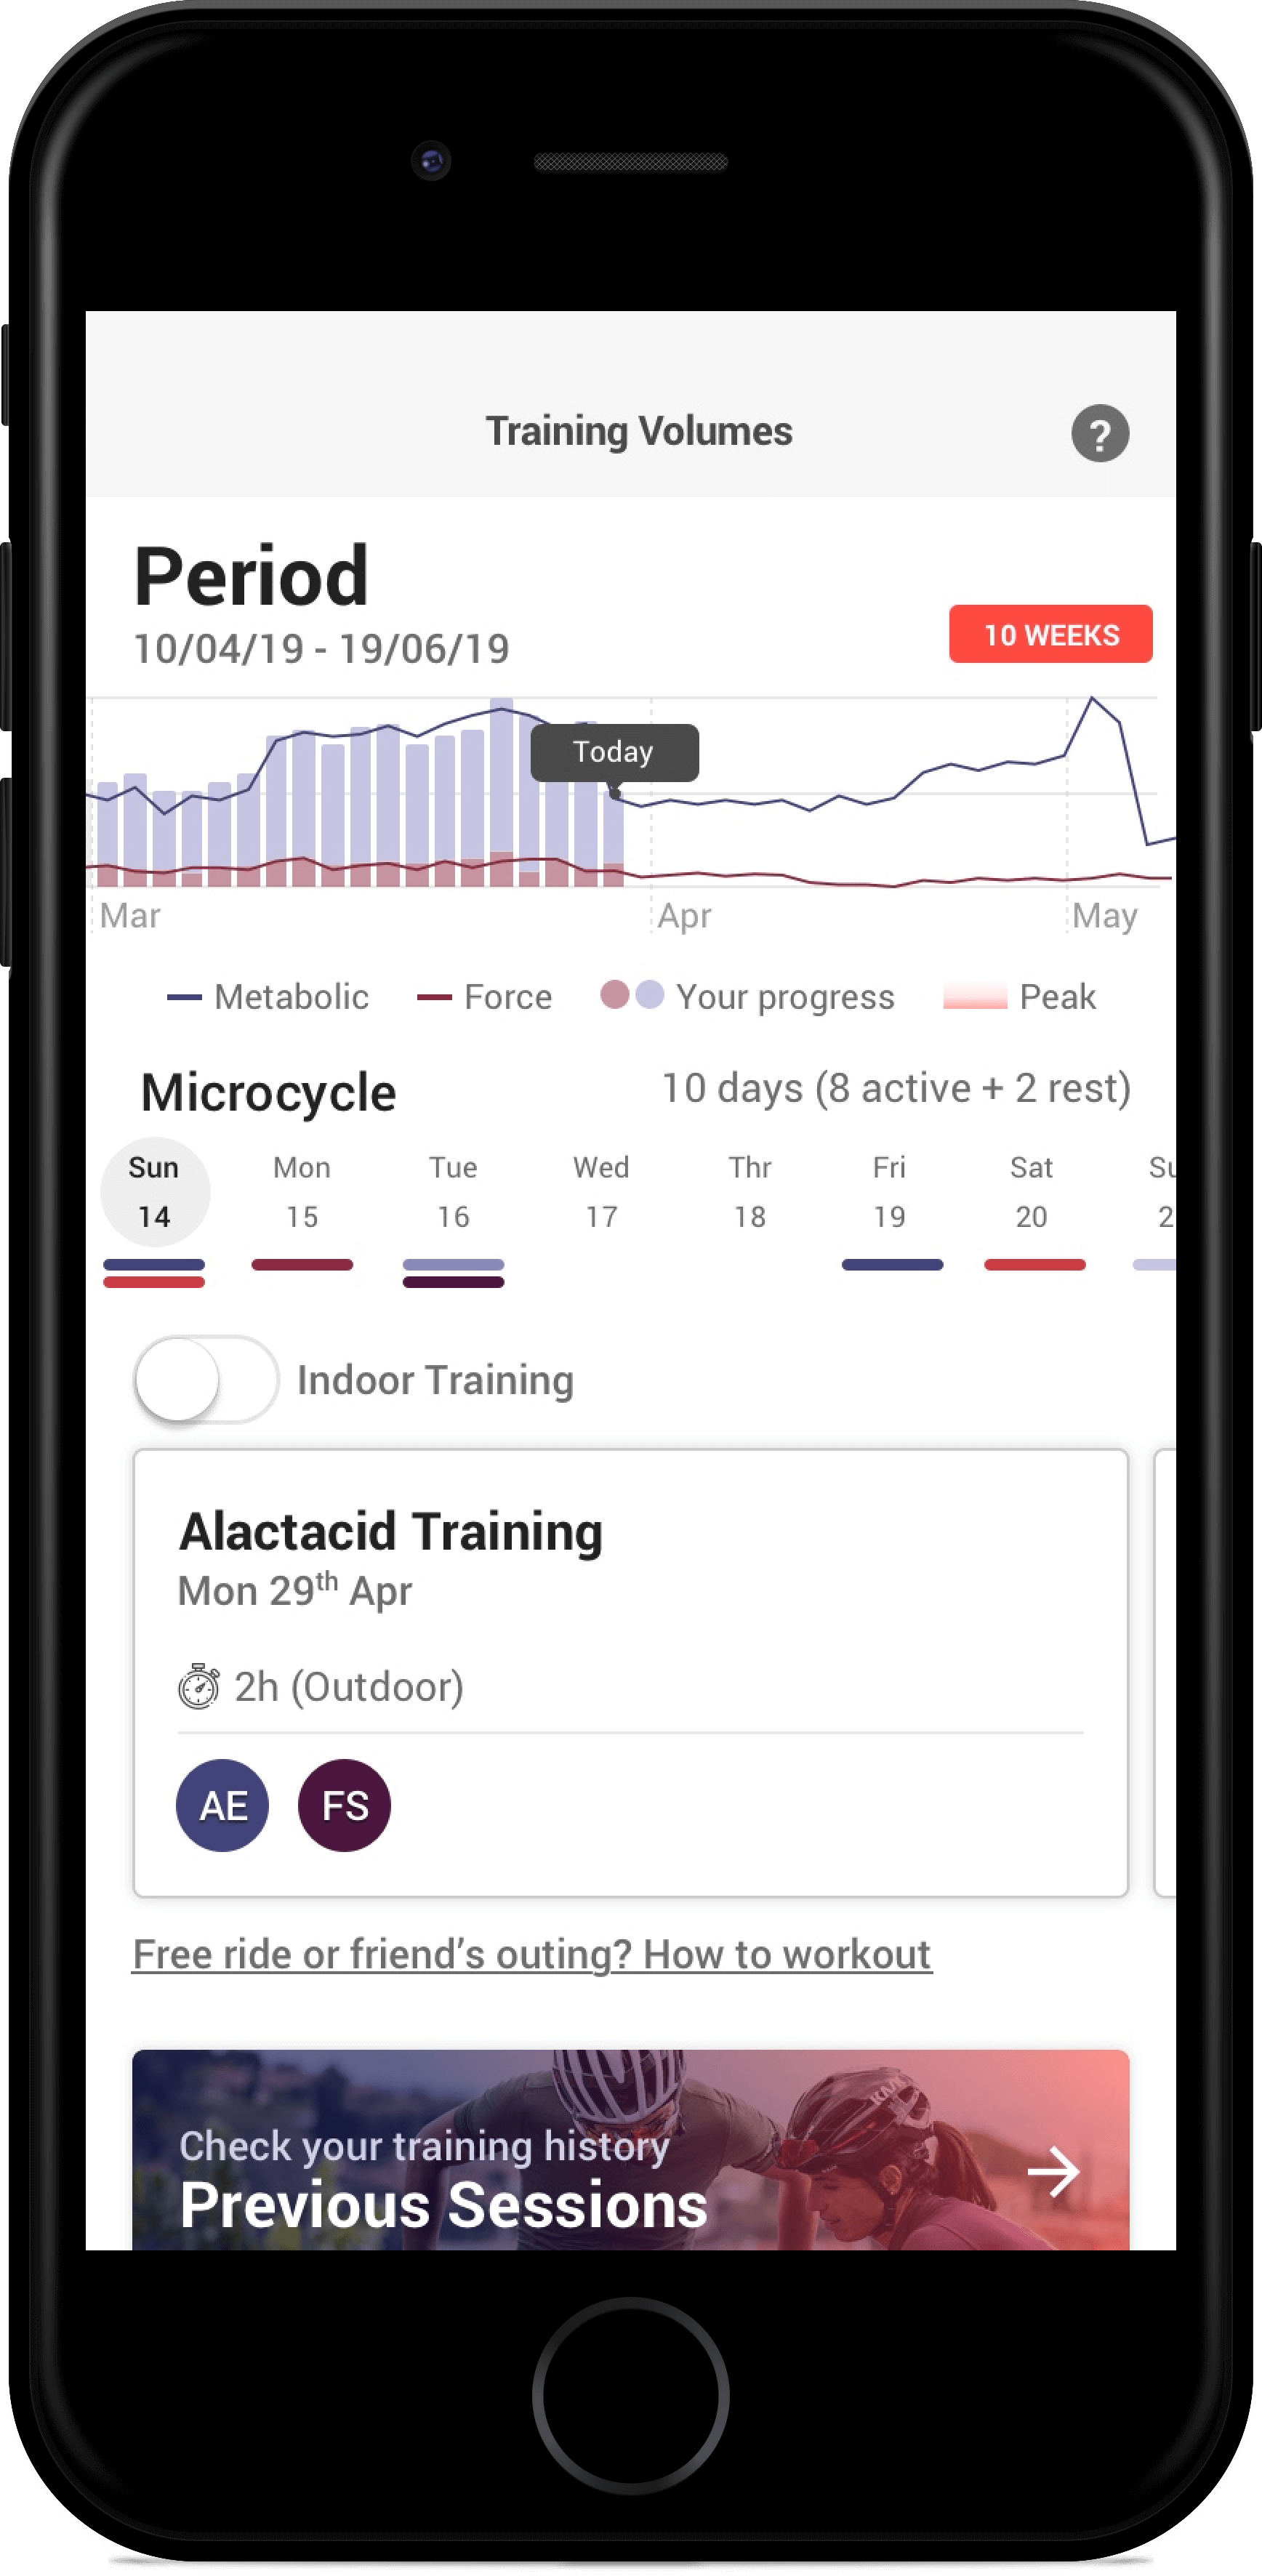
The “training plan” page shows the user a chart of his actual performance during the macrocycle so far.
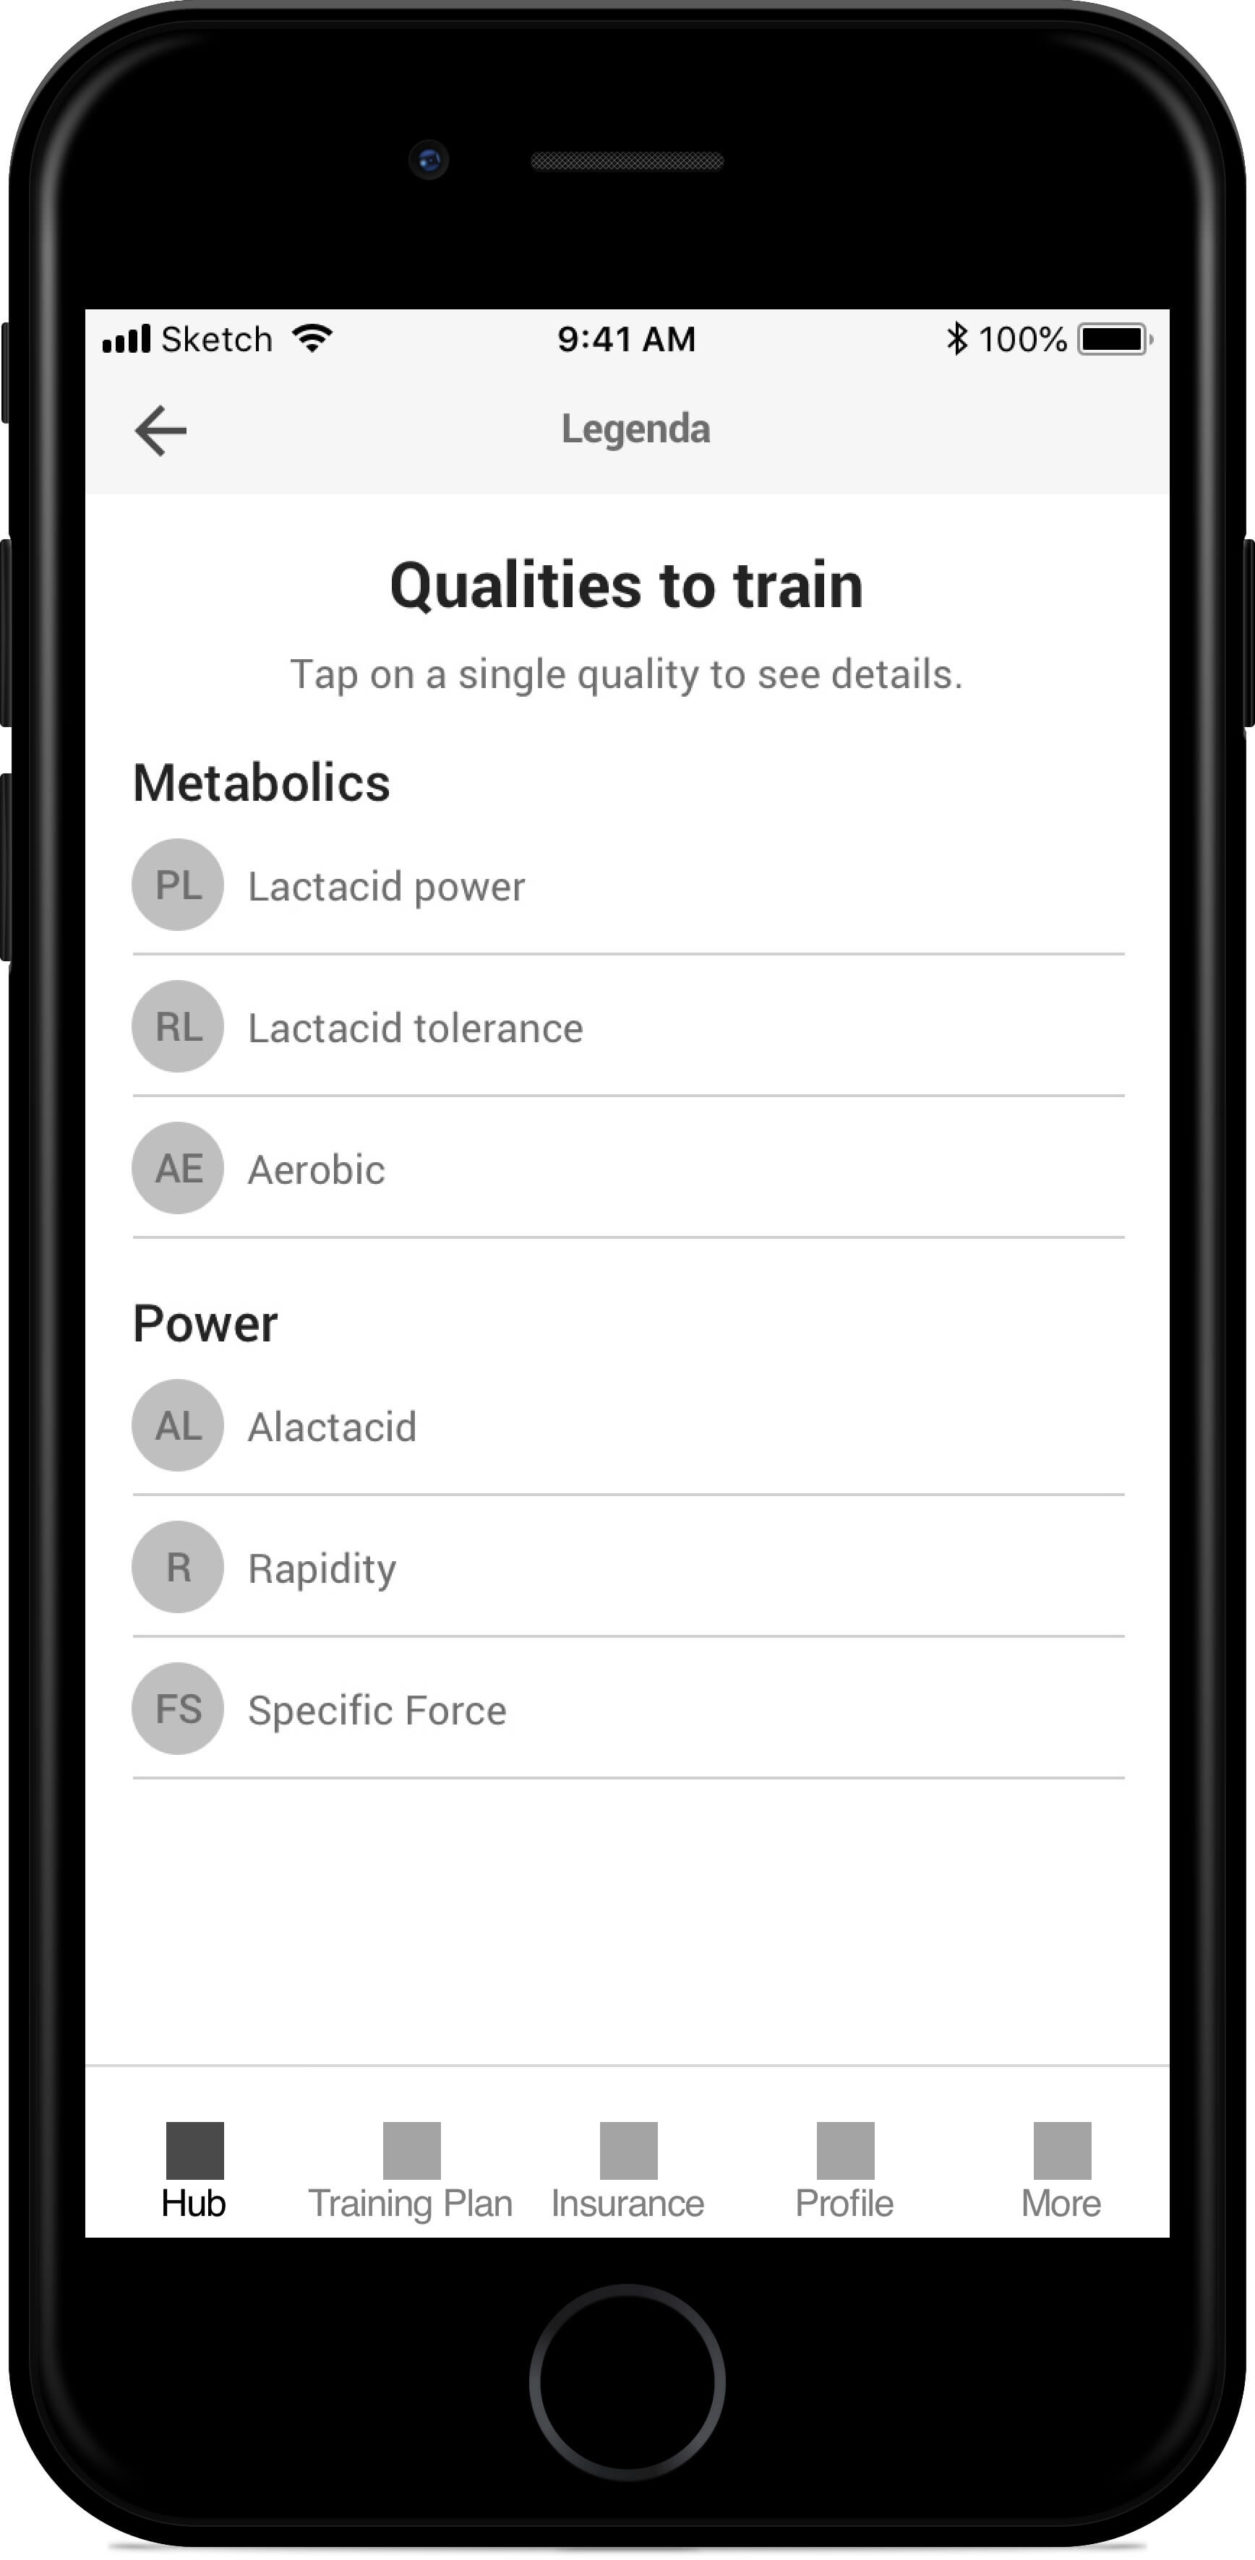
He also has a calendar with the next training scheduled with an indication of the qualities he’s gonna train. In the original proposal, we also show the weather conditions for each day. It was canceled due to too many API requests on the page.
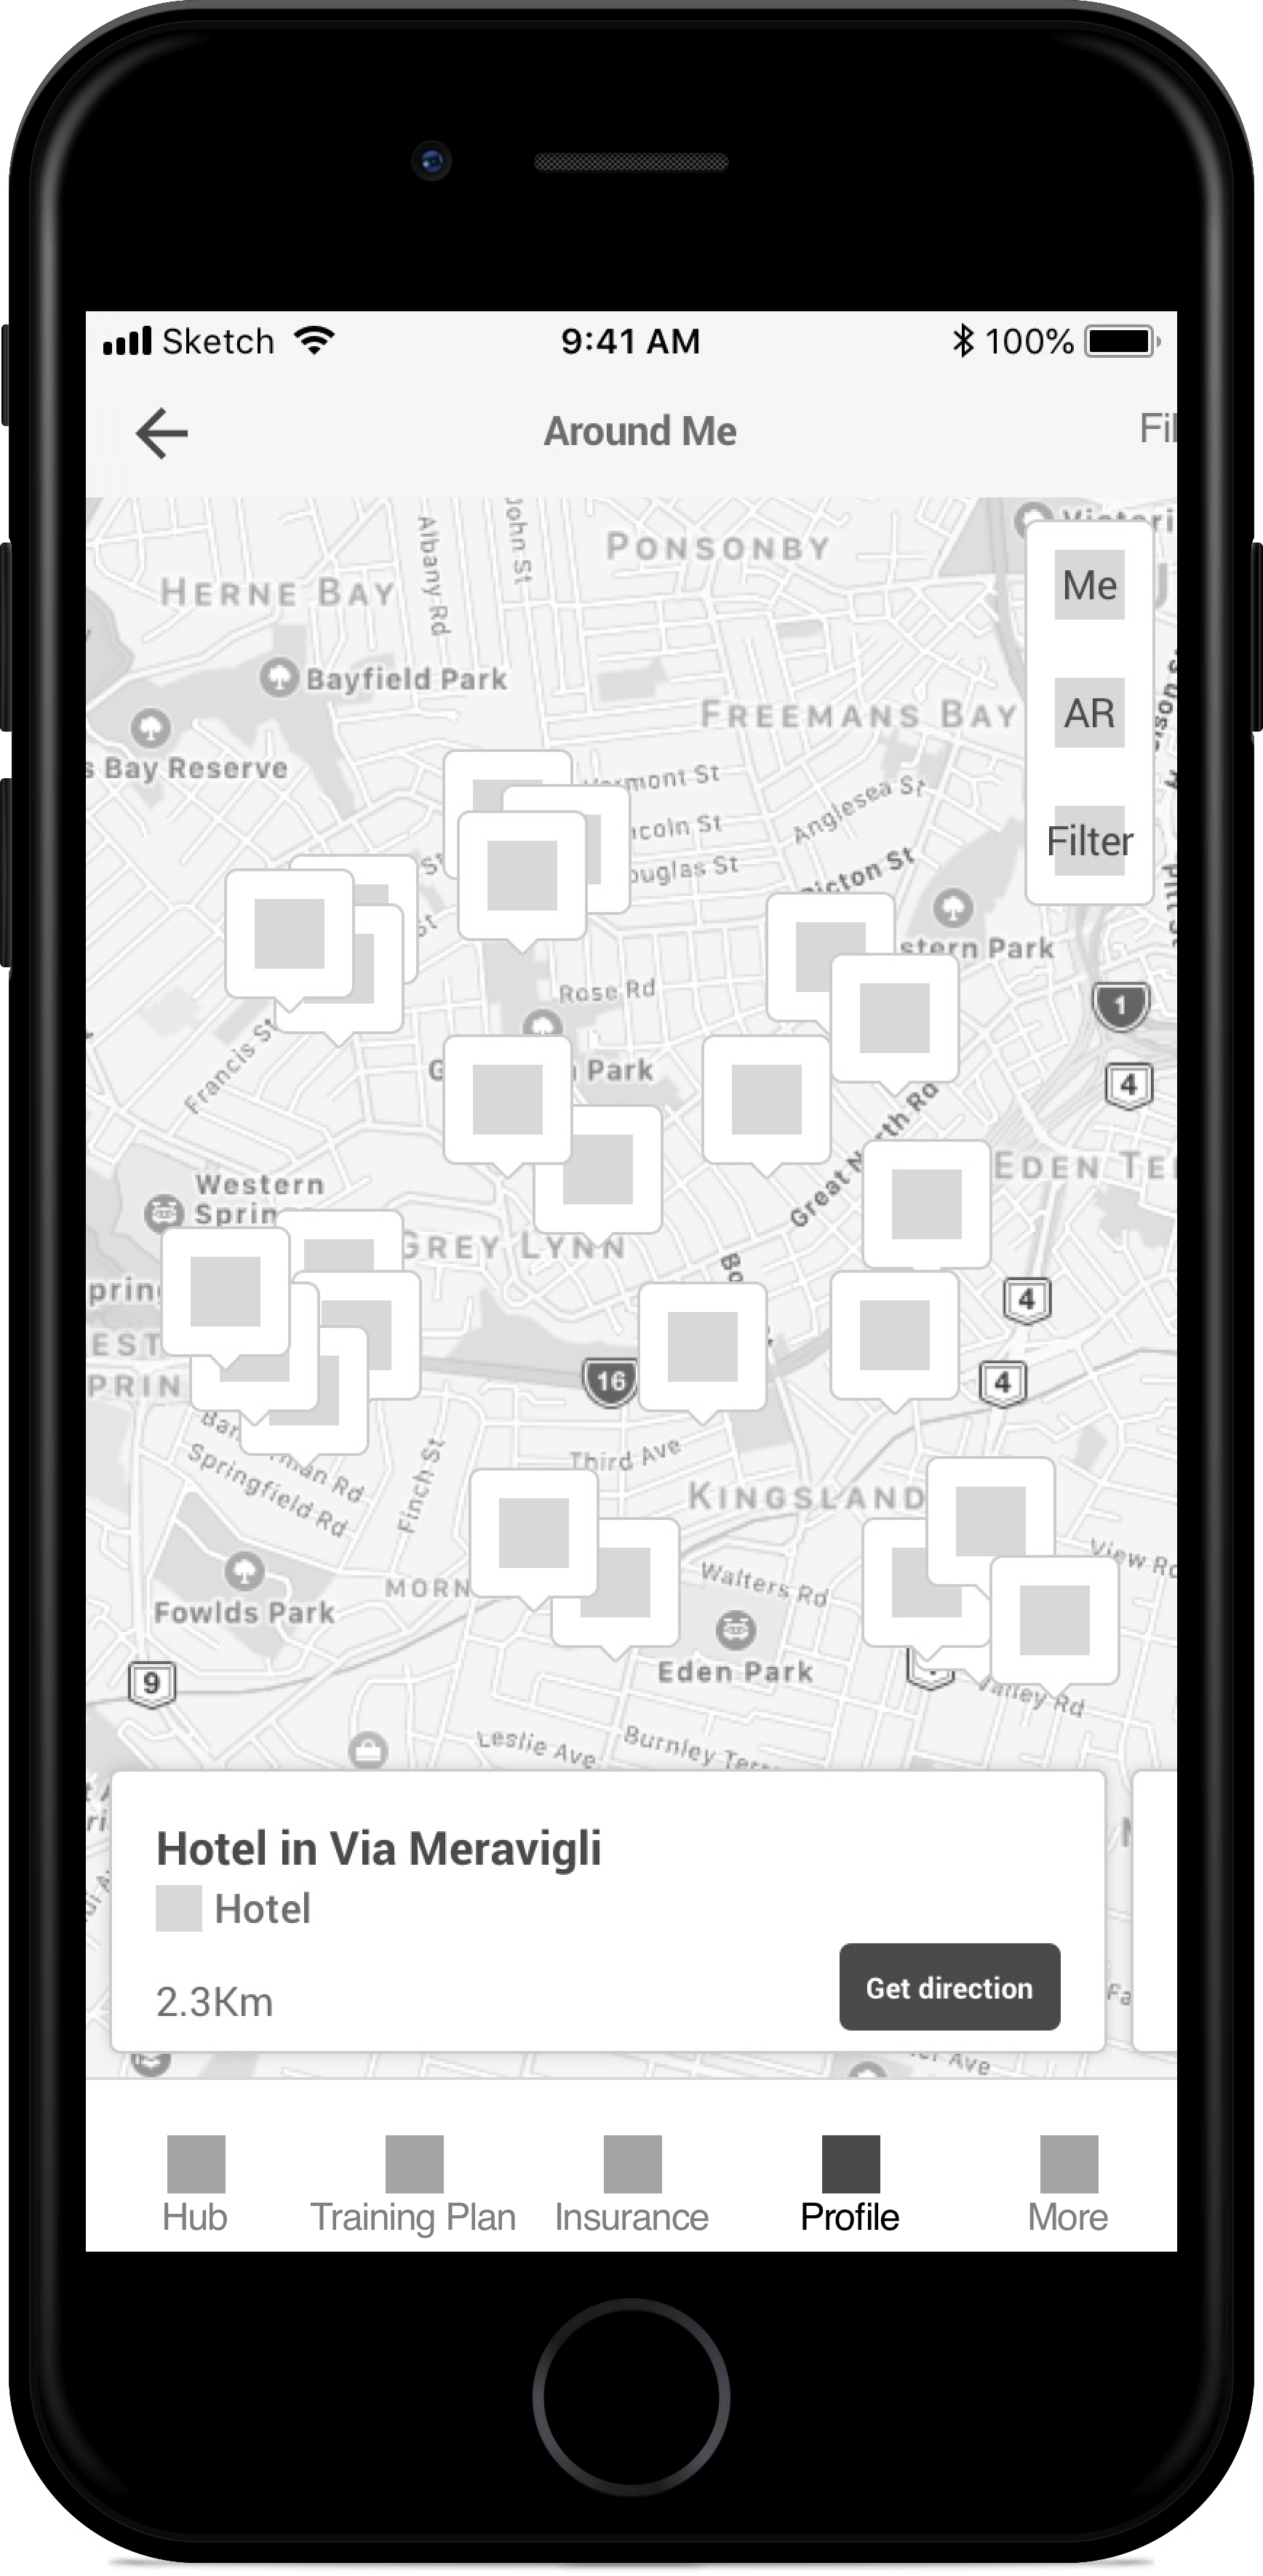
A toggle permit to fast switch from an indoor to an outdoor train; the card below shows what kind of workout user is going to do (even if its a rest day).
Scrolling below, there are some other cards related to daily insurance, segments, place of interest, and season planning.
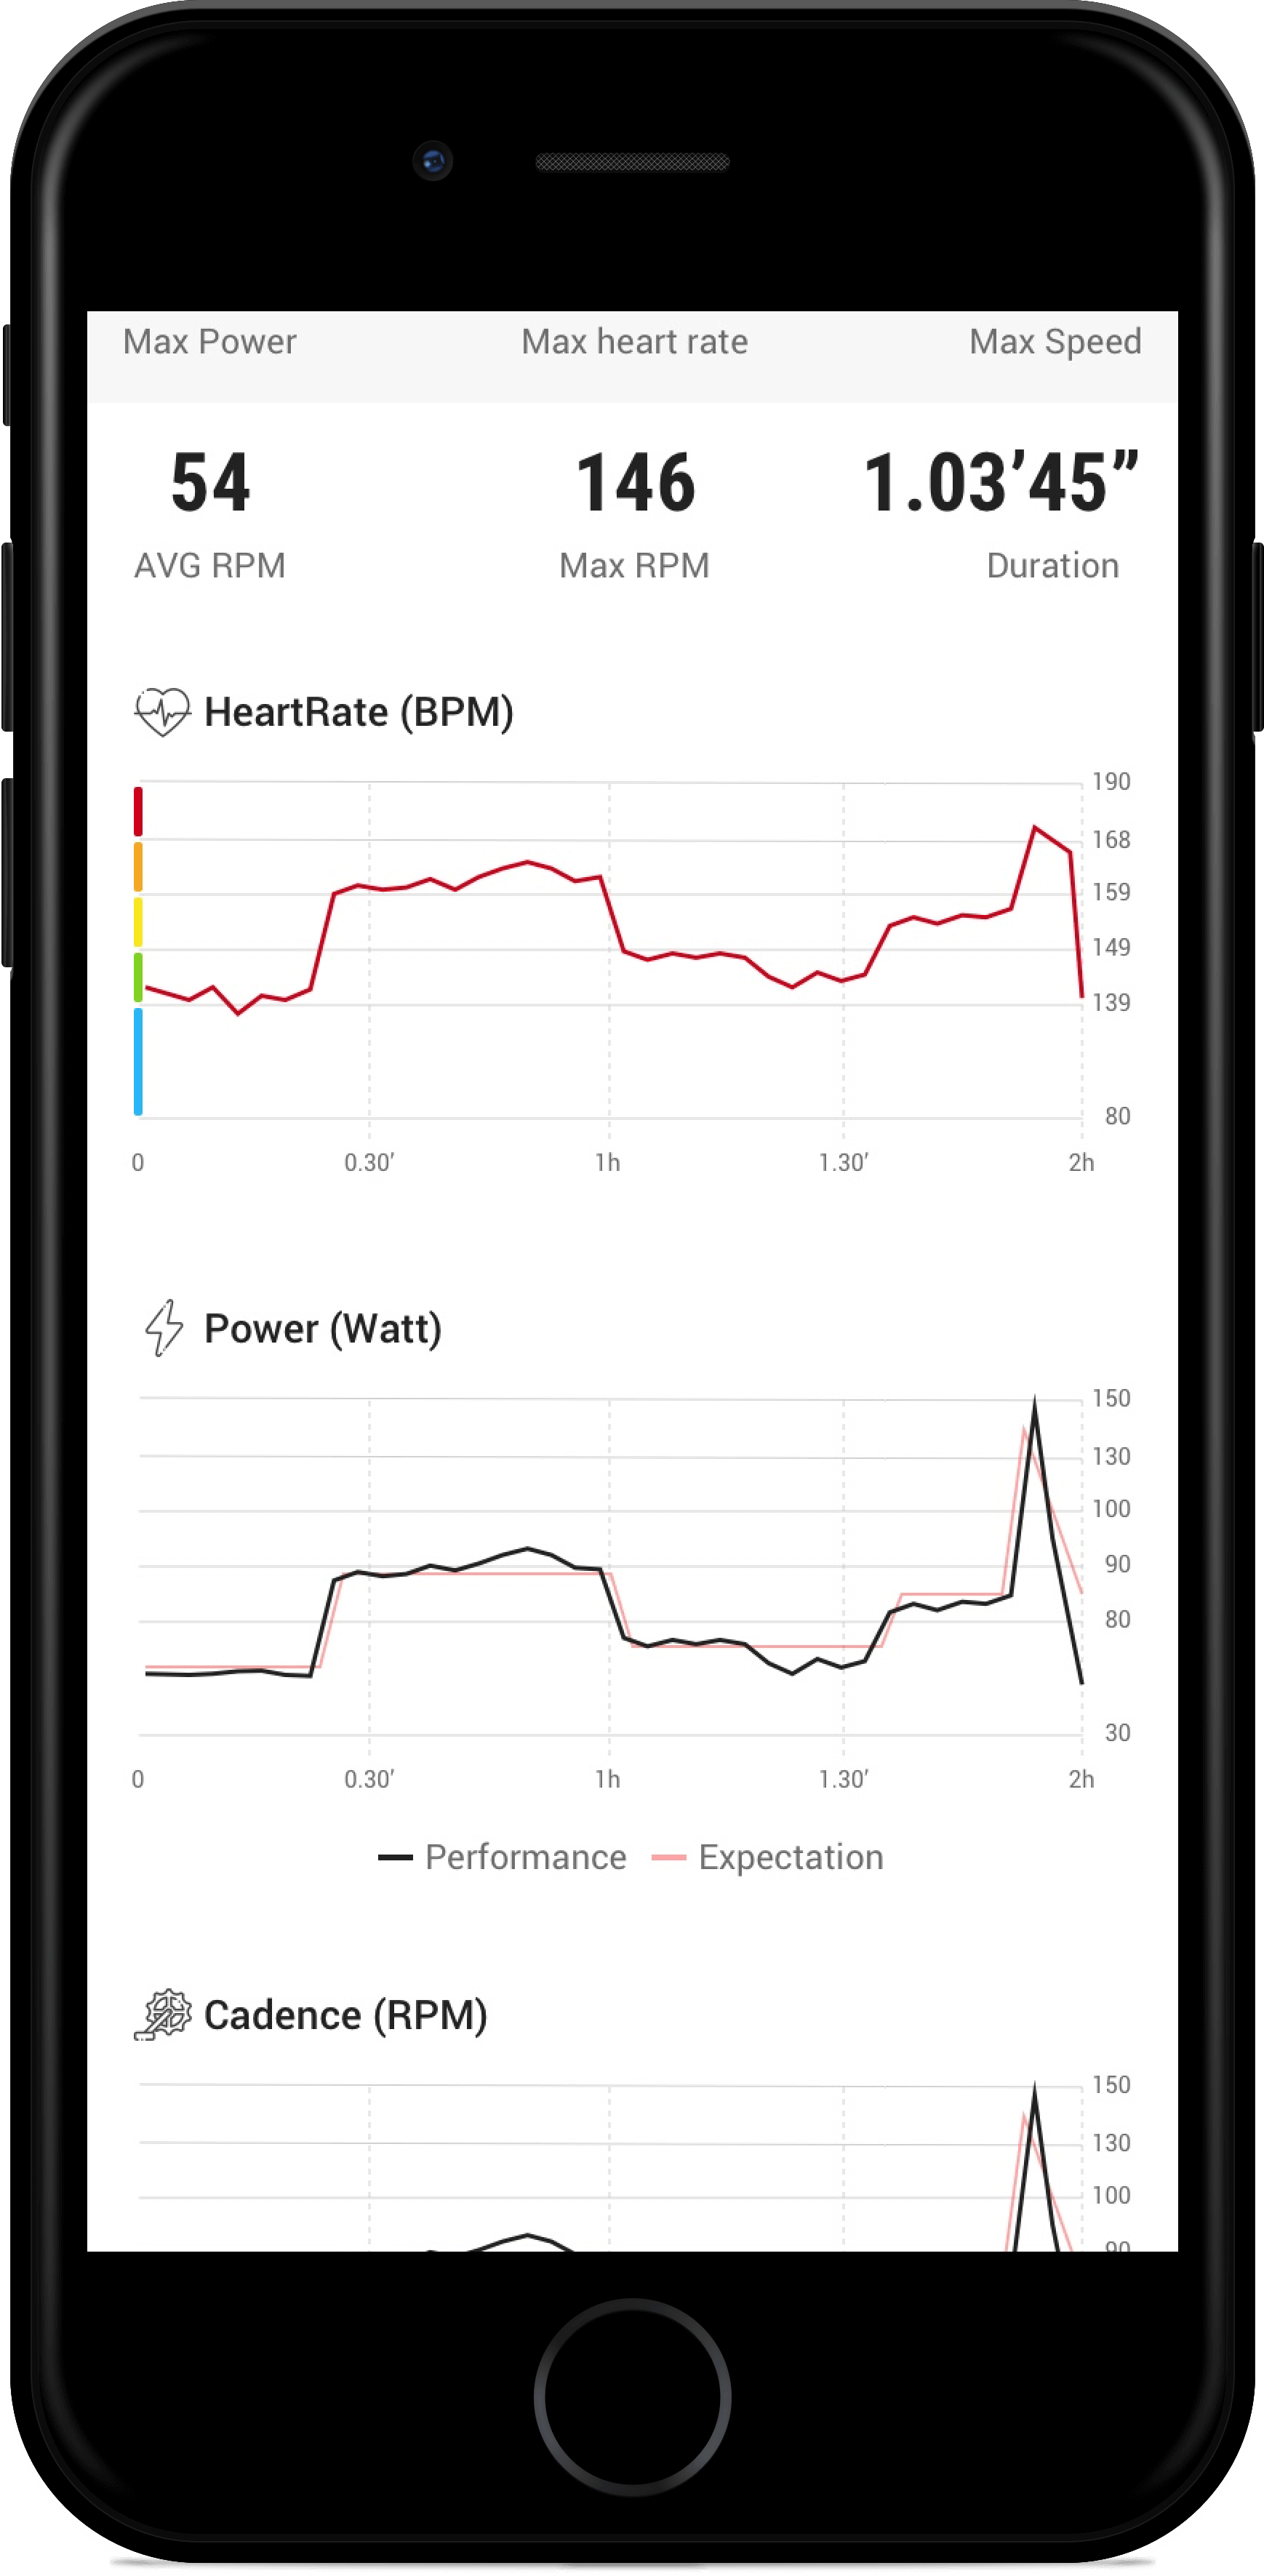
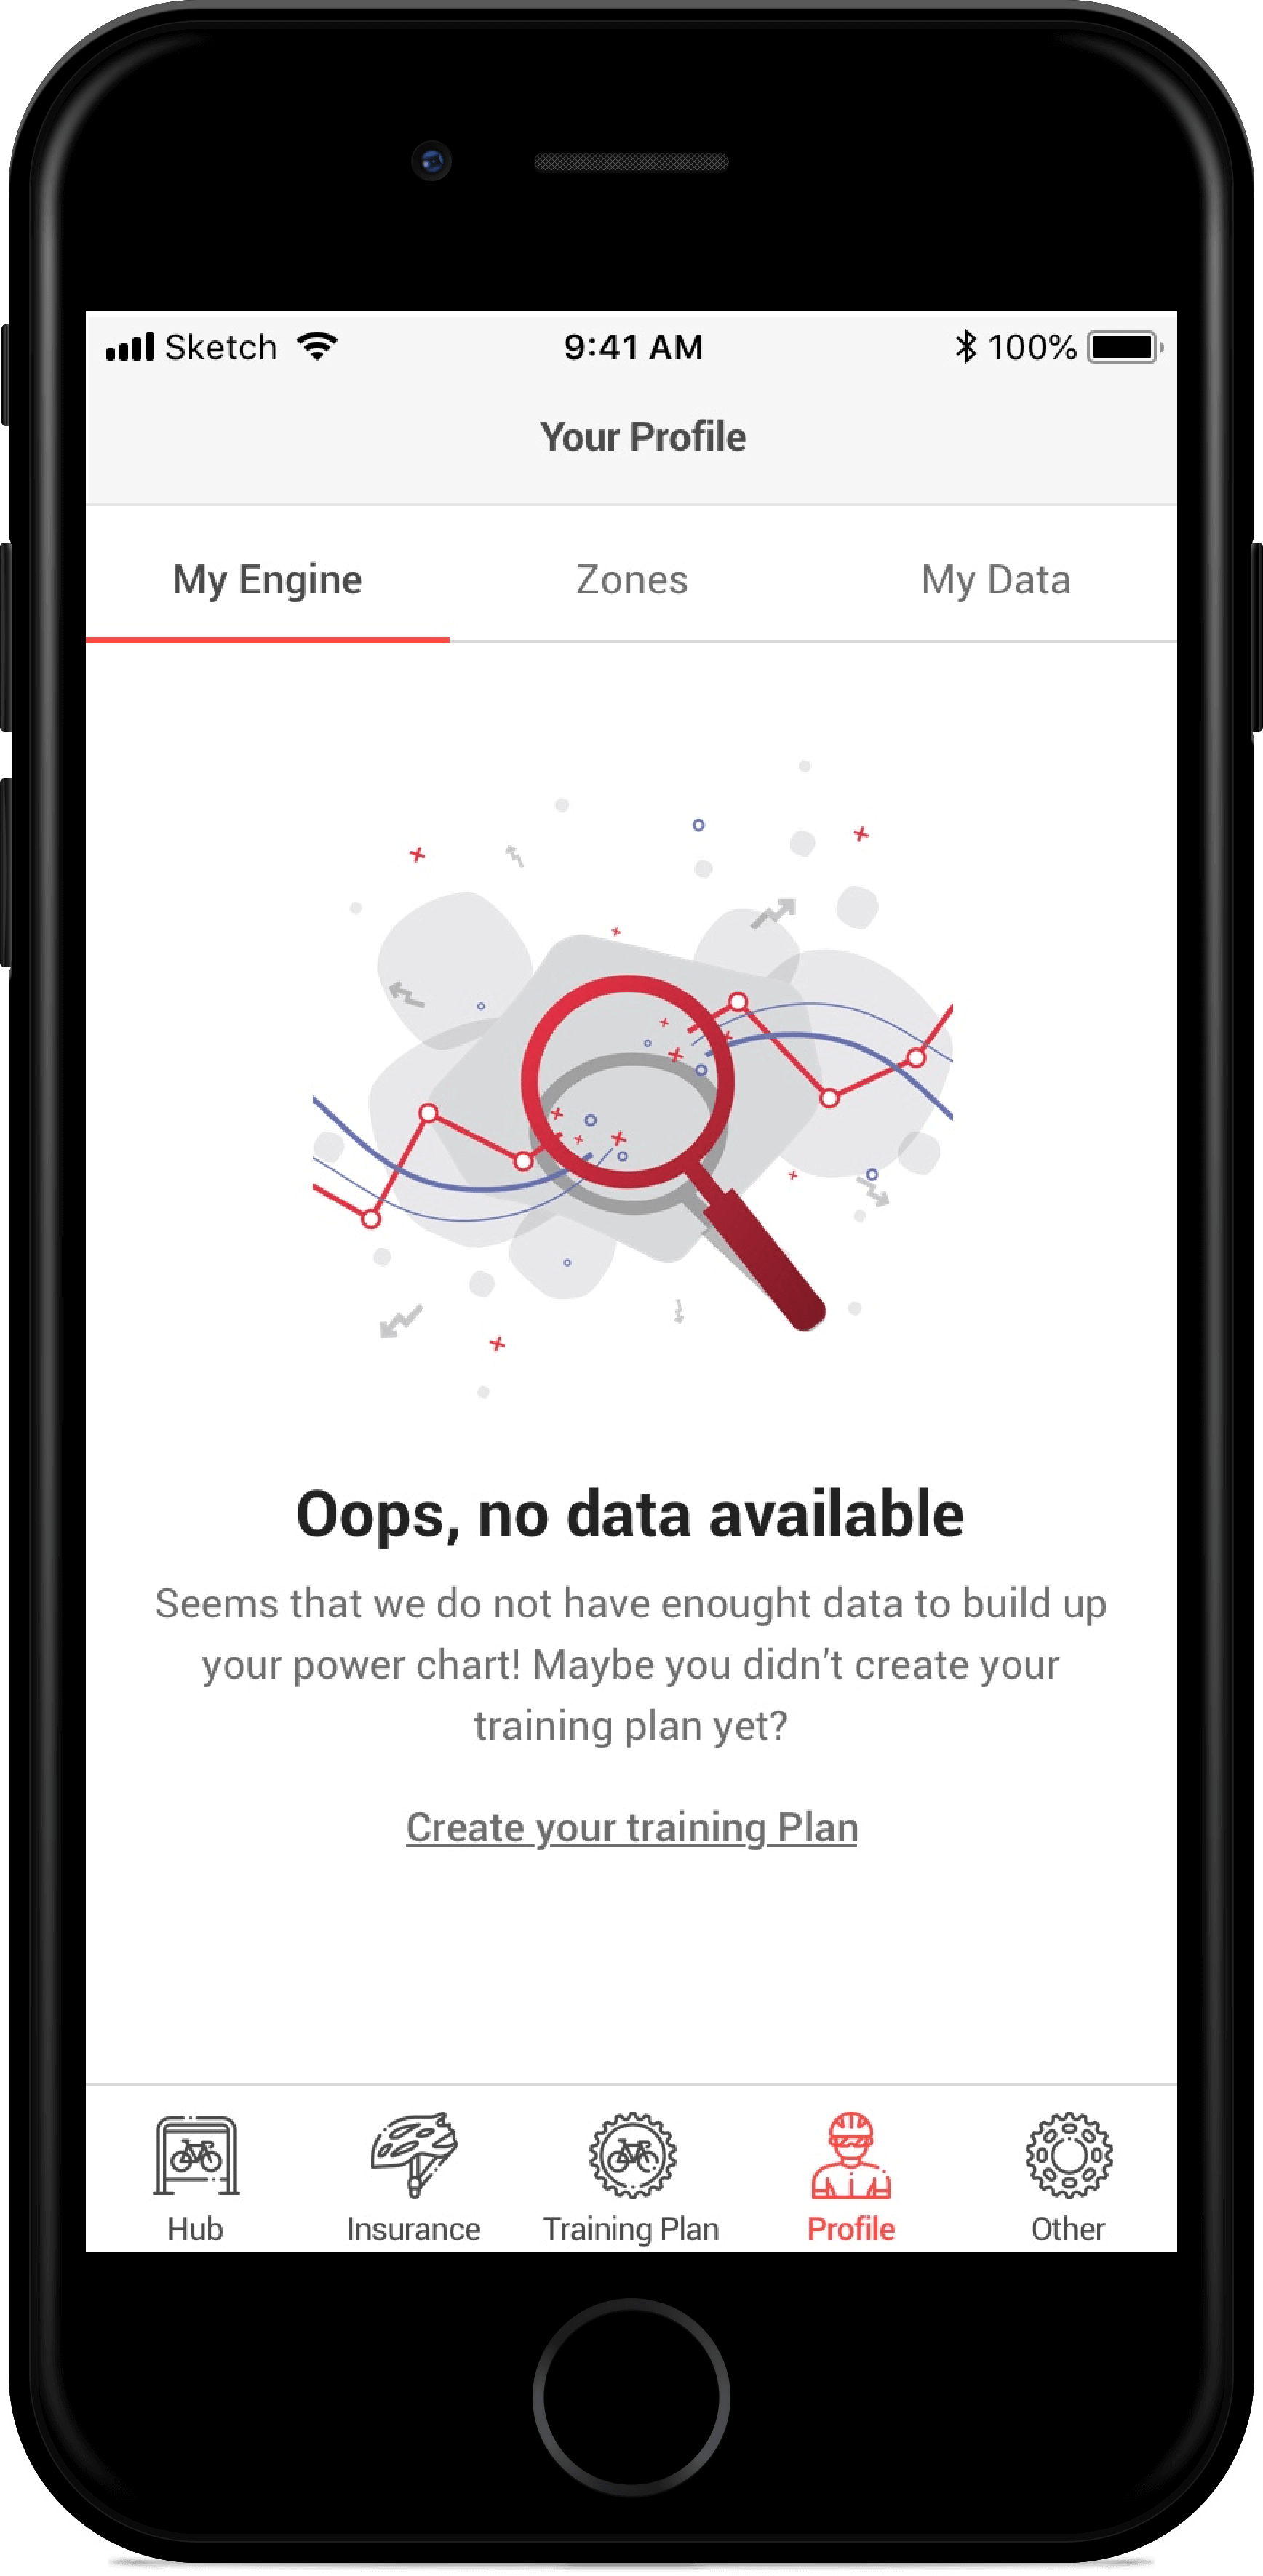
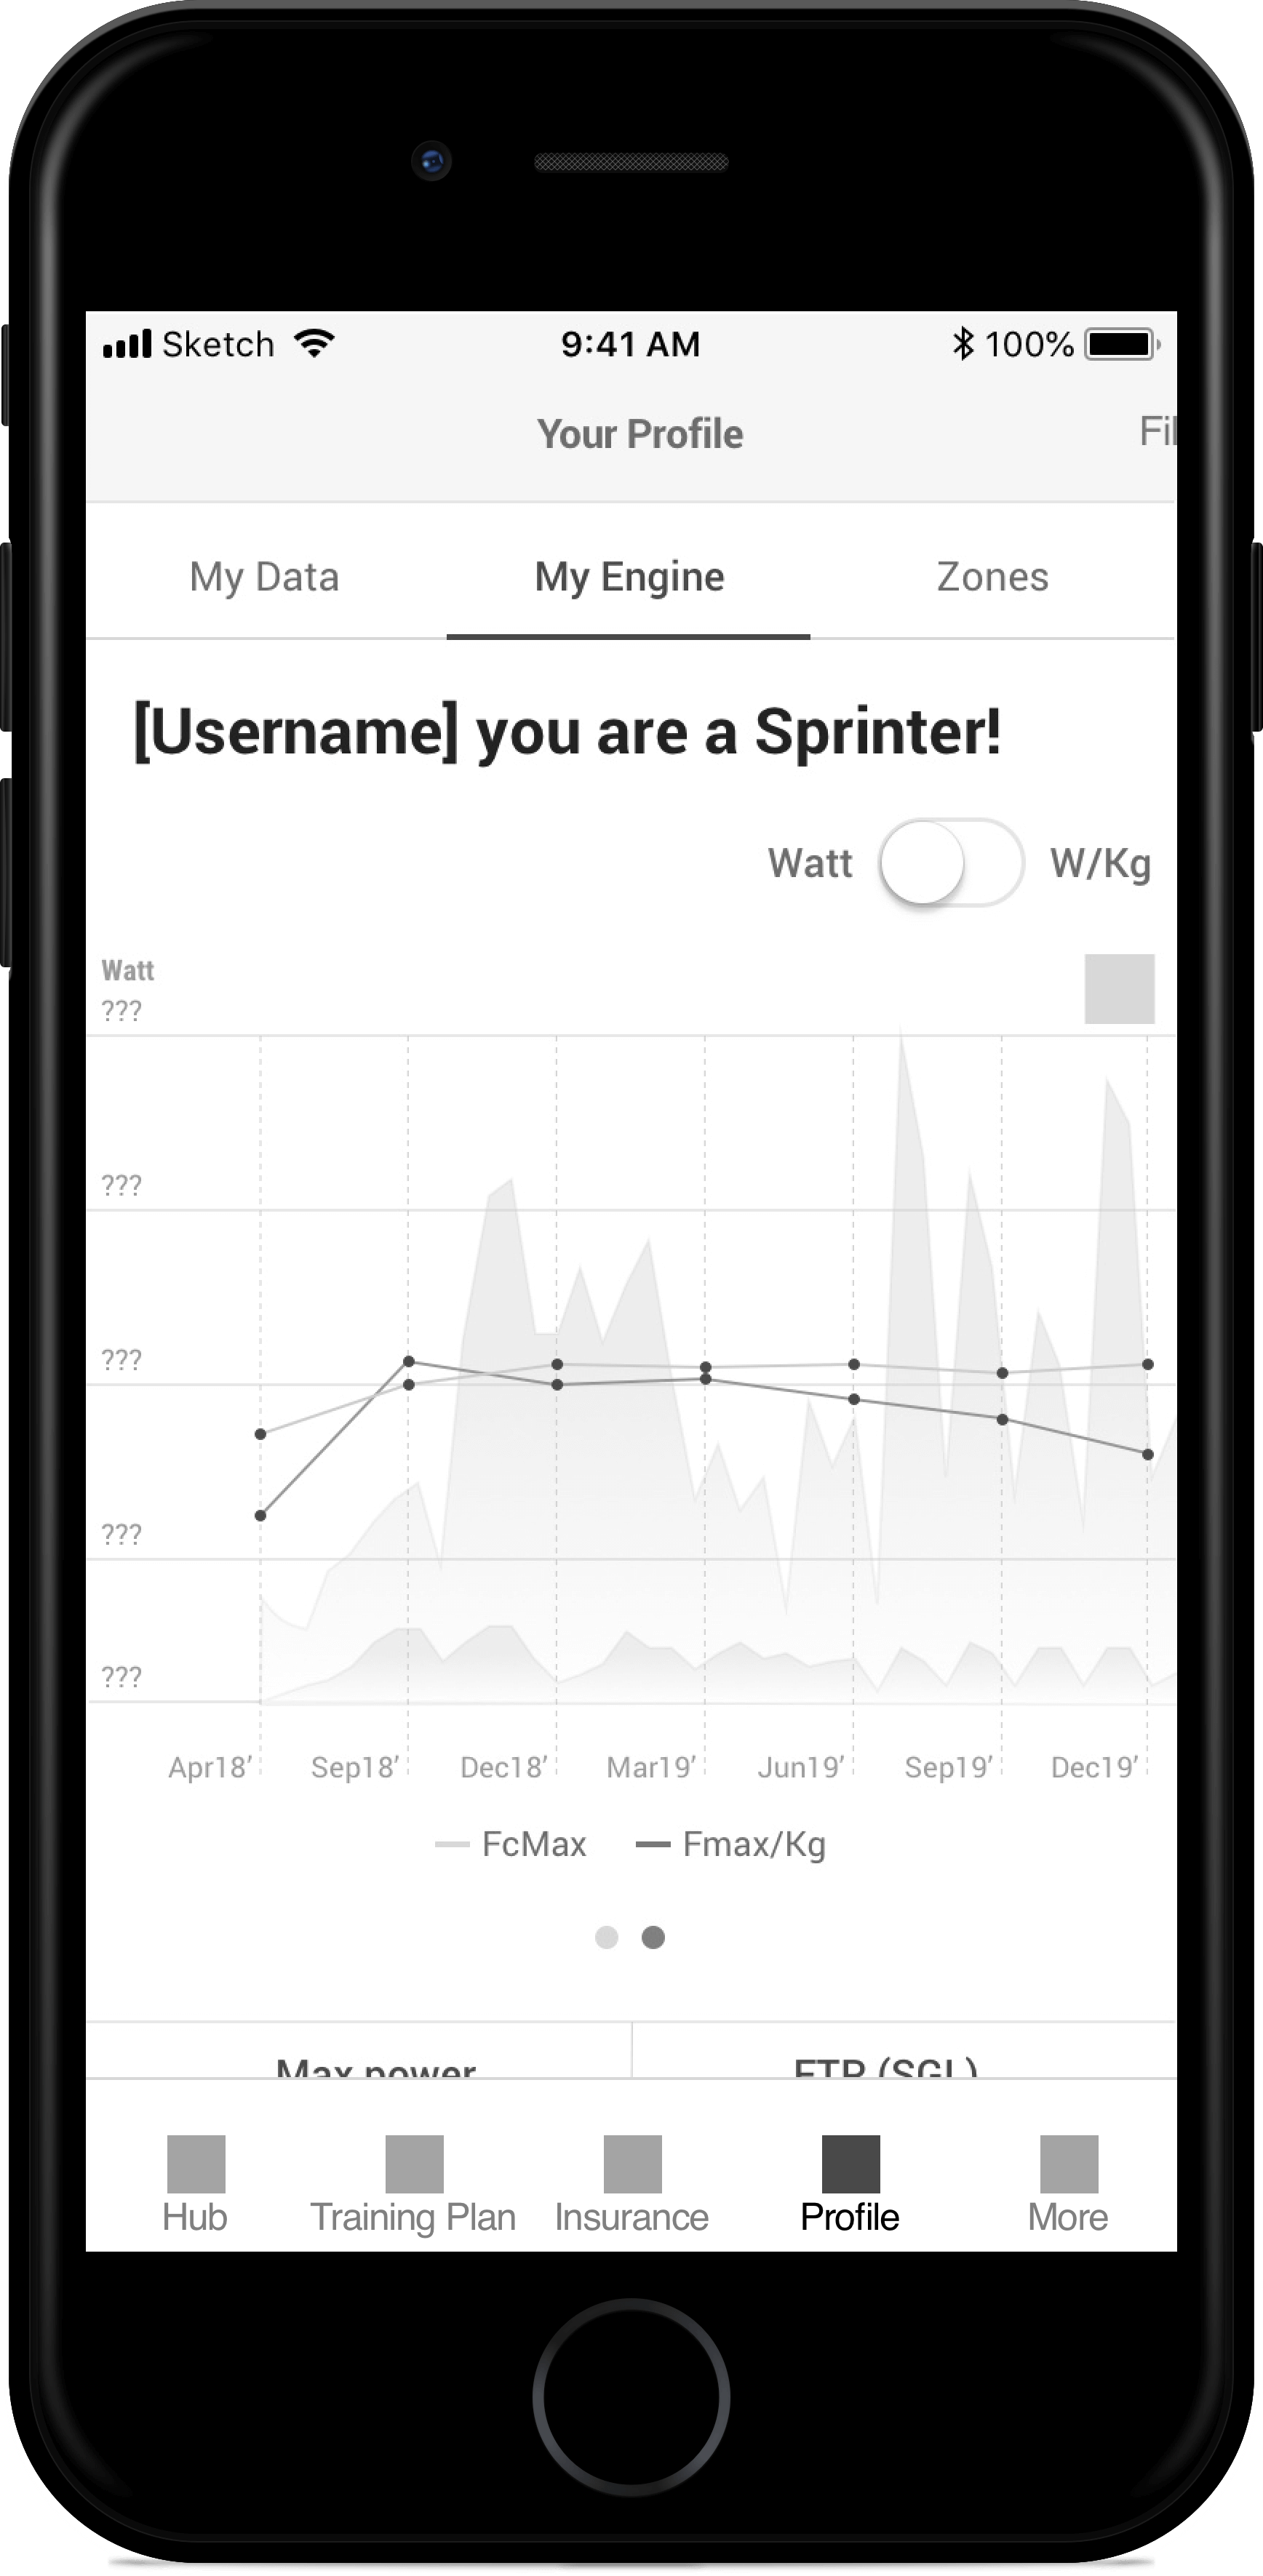
Profile page & other
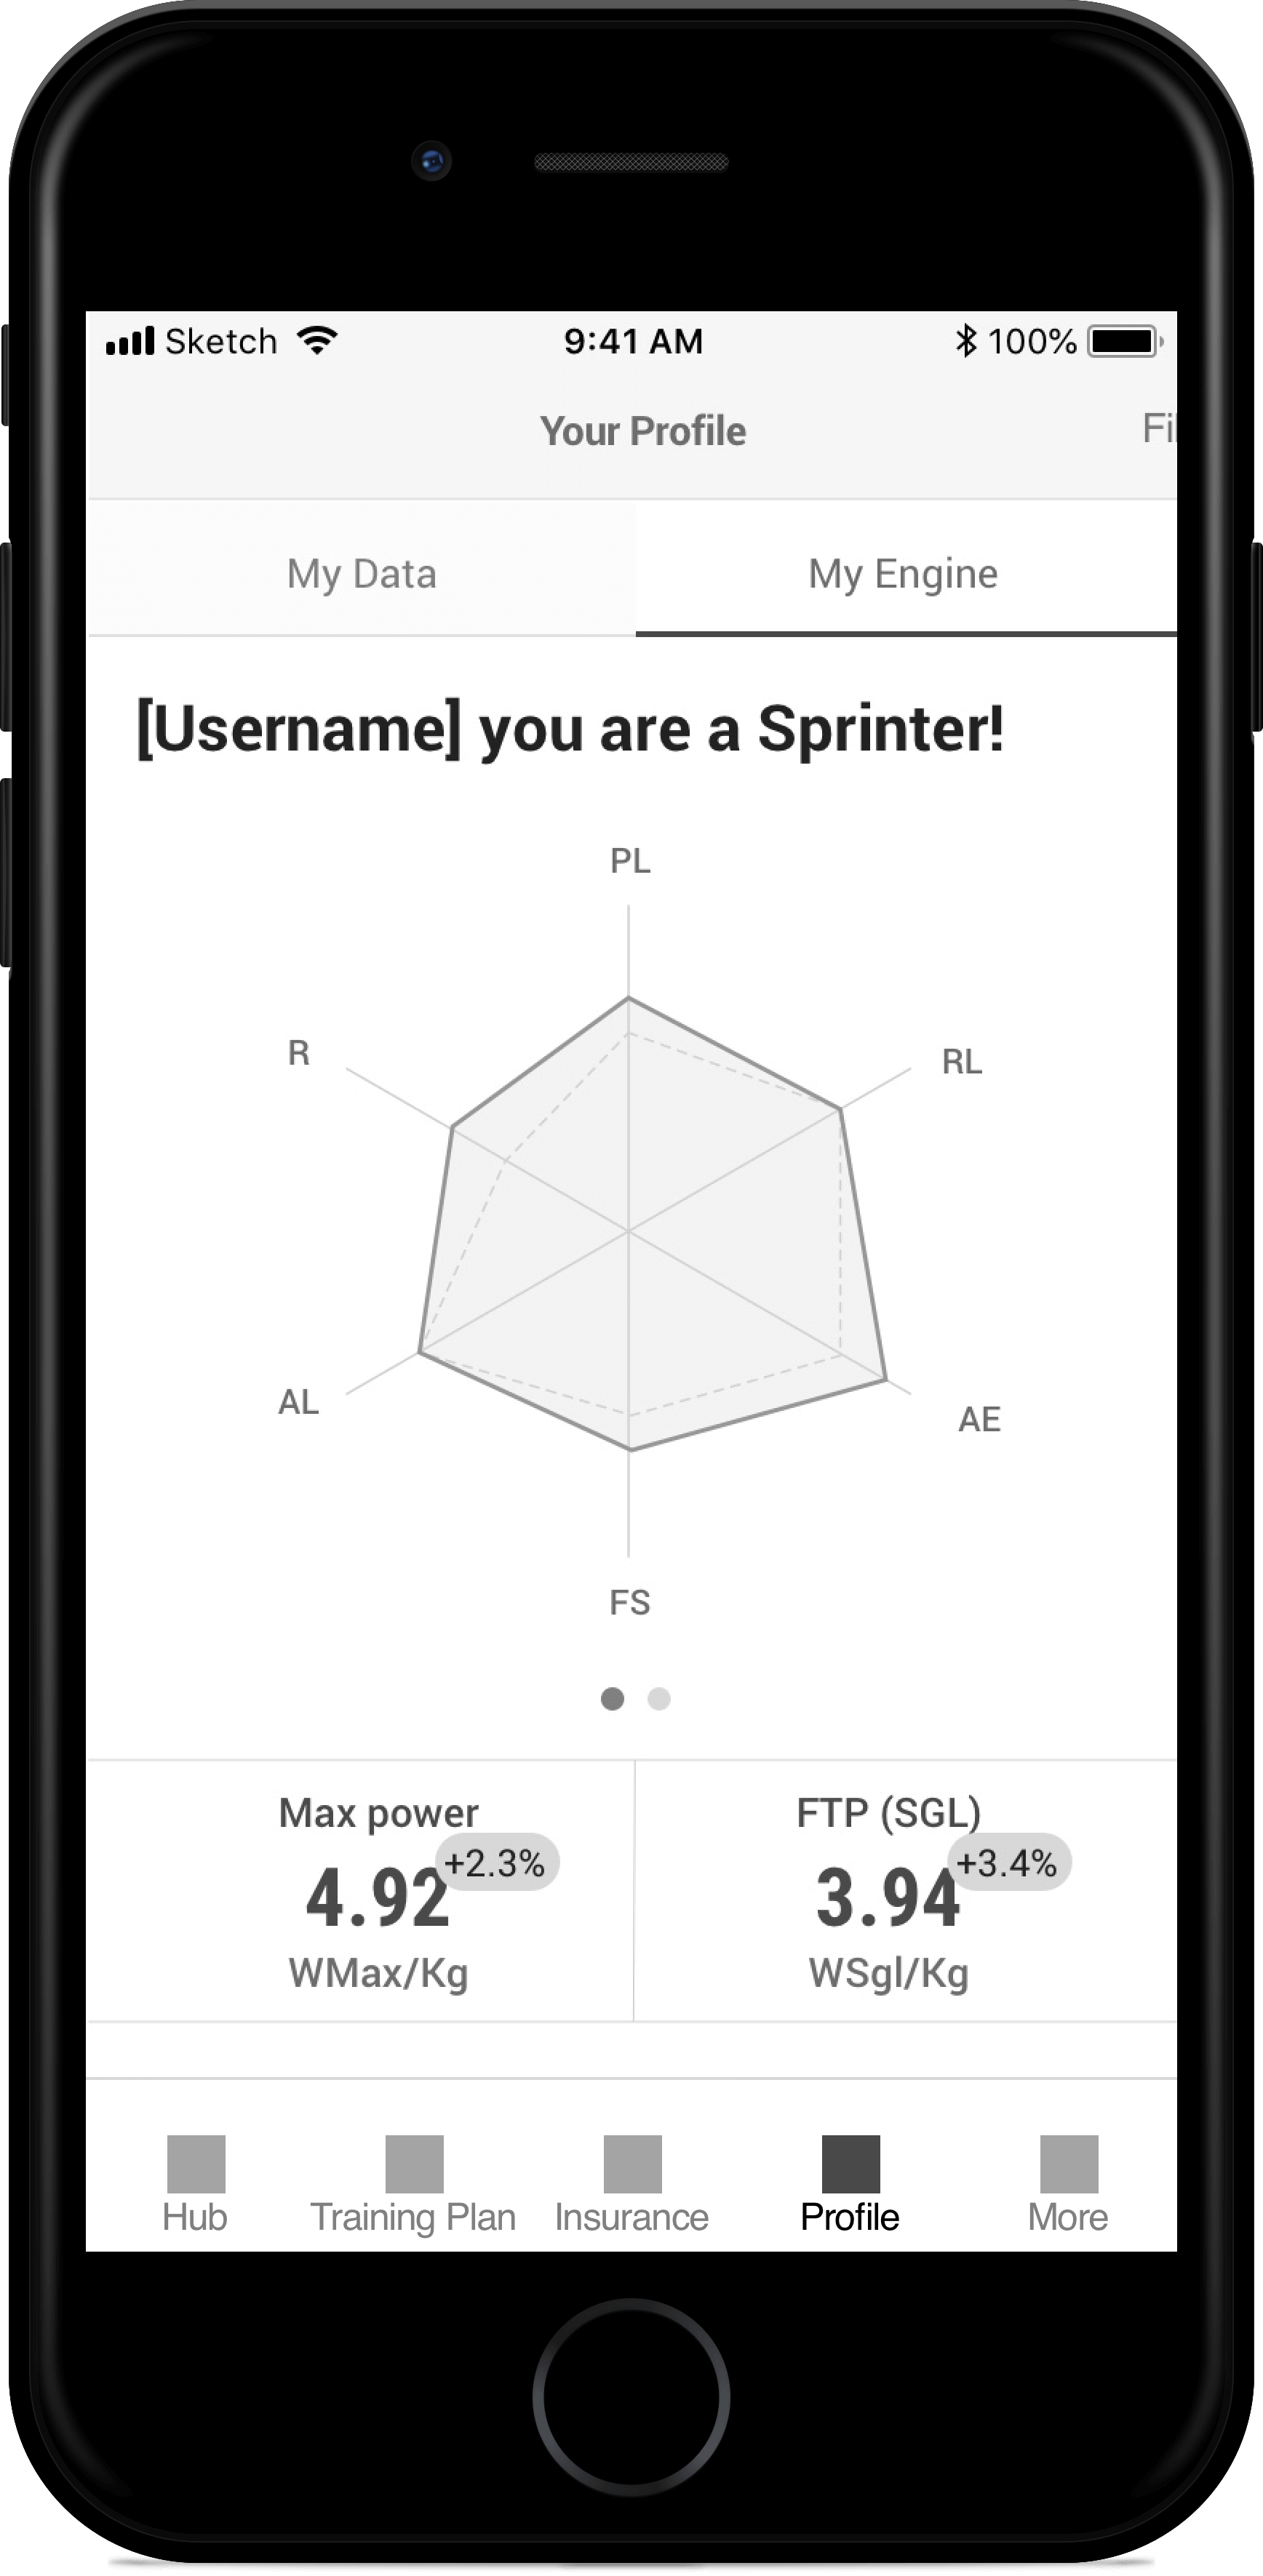
While the “other page” is a collection of settings, low-impact, and low-priority functionalities, the “profile page” has great value for users because it contains the “Your engine” section.
“Engine” is basically the mathematical explanation of the user’s performance. The place where performance data about user’s workouts has been collected and processed to define the parameters set during cyclists’ workout.
It’s not easy to read and understands those charts, they are very technical, but we worked on how the results of their data process have been set and integrated during workouts.
Once the wireframing phase ended I started to convert the screens in the final interface.
First, I created a style guide in terms of color, fonts and gradients based on the Bikevo brand manual (external documentation.)
Then I started to design elements using the atomic design approach to be sure to re-use the same elements every time I needed and also to have different “molecules” elements made by the same atoms.
I also selected an icon set (with some little modification) to make Bikevo’s icon strictly related to the cycling world; while creating a little illustration set for empty pages and the main status of the app.
From Wireframes to the interface